29
/it/
it
AIzaSyAYiBZKx7MnpbEhh9jyipgxe19OcubqV5w
April 1, 2024
101343
Canada
CAN
true
2
1
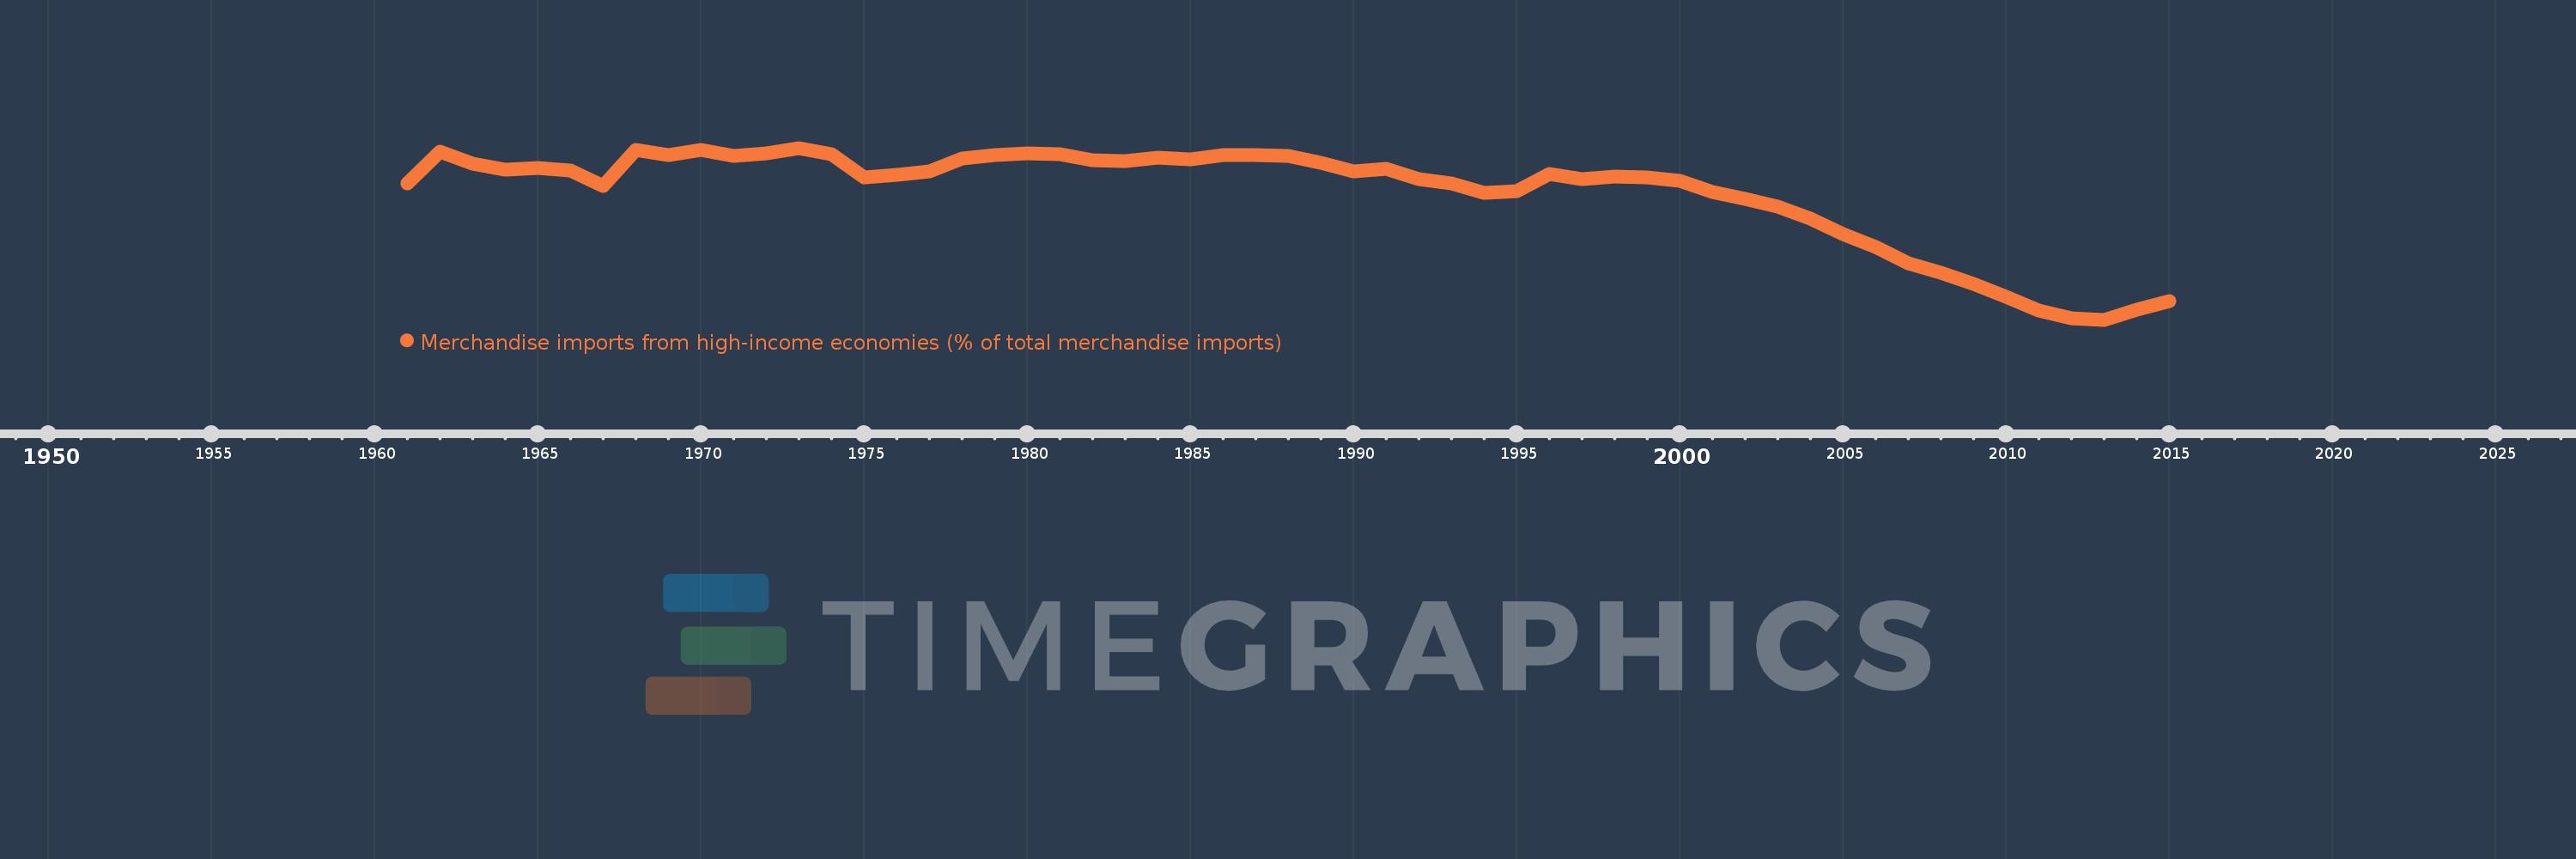
Merchandise imports from high-income economies (% of total merchandise imports)
2015,2014,2013,2012,2011,2010,2009,2008,2007,2006,2005,2004,2003,2002,2001,2000,1999,1998,1997,1996,1995,1994,1993,1992,1991,1990,1989,1988,1987,1986,1985,1984,1983,1982,1981,1980,1979,1978,1977,1976,1975,1974,1973,1972,1971,1970,1969,1968,1967,1966,1965,1964,1963,1962,1961
Queste statistiche in altri paesi:
AfghanistanAlbaniaAlgeriaAngolaAntigua and BarbudaArab WorldArgentinaArmeniaArubaAustraliaAustriaAzerbaijanBahamas, TheBahrainBangladeshBarbadosBelarusBelgiumBelizeBeninBermudaBoliviaBosnia and HerzegovinaBrazilBrunei DarussalamBulgariaBurkina FasoBurundiCabo VerdeCambodiaCameroonCanadaCaribbean small statesCentral African RepublicCentral Europe and the BalticsChadChileChinaColombiaComorosCongo, Dem. Rep.Congo, Rep.Costa RicaCote d'IvoireCroatiaCubaCyprusCzech RepublicDenmarkDjiboutiDominicaDominican RepublicEarly-demographic dividendEast Asia & PacificEast Asia & Pacific (excluding high income)East Asia & Pacific (IDA & IBRD countries)EcuadorEgypt, Arab Rep.El SalvadorEquatorial GuineaEstoniaEthiopiaEuro areaEurope & Central AsiaEurope & Central Asia (excluding high income)Europe & Central Asia (IDA & IBRD countries)European UnionFaroe IslandsFijiFinlandFragile and conflict affected situationsFranceFrench PolynesiaGabonGambia, TheGeorgiaGermanyGhanaGibraltarGreeceGreenlandGrenadaGuamGuatemalaGuineaGuinea-BissauGuyanaHaitiHeavily indebted poor countries (HIPC)High incomeHondurasHong Kong SAR, ChinaHungaryIBRD onlyIcelandIDA & IBRD totalIDA blendIDA onlyIDA totalIndiaIndonesiaIran, Islamic Rep.IraqIrelandIsraelItalyJamaicaJapanJordanKazakhstanKenyaKiribatiKorea, Dem. People’s Rep.Korea, Rep.KosovoKuwaitKyrgyz RepublicLao PDRLate-demographic dividendLatin America & Caribbean Latin America & Caribbean (excluding high income)Latin America & the Caribbean (IDA & IBRD countries)LatviaLeast developed countries: UN classificationLebanonLiberiaLibyaLithuaniaLow & middle incomeLow incomeLower middle incomeLuxembourgMacao SAR, ChinaMacedonia, FYRMadagascarMalawiMalaysiaMaldivesMaliMaltaMauritaniaMauritiusMexicoMiddle East & North AfricaMiddle East & North Africa (excluding high income)Middle East & North Africa (IDA & IBRD countries)Middle incomeMoldovaMongoliaMontenegroMoroccoMozambiqueMyanmarNauruNepalNetherlandsNew CaledoniaNew ZealandNicaraguaNigerNigeriaNorth AmericaNorwayOECD membersOmanOther small statesPacific island small statesPakistanPanamaPapua New GuineaParaguayPeruPhilippinesPolandPortugalPost-demographic dividendPre-demographic dividendQatarRomaniaRussian FederationRwandaSamoaSao Tome and PrincipeSaudi ArabiaSenegalSerbiaSeychellesSierra LeoneSingaporeSlovak RepublicSloveniaSmall statesSolomon IslandsSomaliaSouth AfricaSouth AsiaSouth Asia (IDA & IBRD)SpainSri LankaSt. Kitts and NevisSt. LuciaSt. Vincent and the GrenadinesSub-Saharan Africa Sub-Saharan Africa (excluding high income)Sub-Saharan Africa (IDA & IBRD countries)SudanSurinameSwedenSwitzerlandSyrian Arab RepublicTajikistanTanzaniaThailandTogoTongaTrinidad and TobagoTunisiaTurkeyTurkmenistanTuvaluUgandaUkraineUnited Arab EmiratesUnited KingdomUnited StatesUpper middle incomeUruguayUzbekistanVanuatuVenezuela, RBVietnamWorldYemen, Rep.ZambiaZimbabwe Linea del tempo:
Questa scala temporale mostra un grafico dal 1961 anno al 2015 anno. Canada. I dati fino ad 1960 anno non disponibili. Il numero di osservazioni attuali secondo i date: 55.
La fonte (nome):
Indicatori dello sviluppo mondiale
La fonte (organizzazione):
World Bank staff estimates based data from International Monetary Fund's Direction of Trade database.
Categorie:
Private Sector, Trade
sono stati aggiornati
23 apr 2017 anni
Indicatori delle variazioni dei valori per anni
Minima:
71.897
1 gen 2013 anni
Massimo:
92.177
1 gen 1973 anni
Alla data di osservazione
Valore
Variazione assoluta
La variazione rispetto al valore precedente
1 gen 1961 anni
87.973
+87.973
0.0%
1 gen 1962 anni
91.773
+3.8
4.32%
1 gen 1963 anni
90.304
-1.469
-1.6%
1 gen 1964 anni
89.637
-0.667
-0.74%
1 gen 1965 anni
89.779
+0.142
0.16%
1 gen 1966 anni
89.469
-0.31
-0.35%
1 gen 1967 anni
87.704
-1.764
-1.97%
1 gen 1968 anni
91.943
+4.238
4.83%
1 gen 1969 anni
91.302
-0.641
-0.7%
1 gen 1970 anni
91.953
+0.651
0.71%
1 gen 1971 anni
91.256
-0.697
-0.76%
1 gen 1972 anni
91.55
+0.294
0.32%
1 gen 1973 anni
92.177
+0.628
0.69%
1 gen 1974 anni
91.405
-0.773
-0.84%
1 gen 1975 anni
88.743
-2.662
-2.91%
1 gen 1976 anni
88.959
+0.216
0.24%
1 gen 1977 anni
89.409
+0.451
0.51%
1 gen 1978 anni
90.956
+1.547
1.73%
1 gen 1979 anni
91.3
+0.344
0.38%
1 gen 1980 anni
91.582
+0.282
0.31%
1 gen 1981 anni
91.443
-0.139
-0.15%
1 gen 1982 anni
90.776
-0.666
-0.73%
1 gen 1983 anni
90.637
-0.139
-0.15%
1 gen 1984 anni
90.991
+0.353
0.39%
1 gen 1985 anni
90.826
-0.165
-0.18%
1 gen 1986 anni
91.297
+0.471
0.52%
1 gen 1987 anni
91.33
+0.033
0.04%
1 gen 1988 anni
91.282
-0.048
-0.05%
1 gen 1989 anni
90.432
-0.85
-0.93%
1 gen 1990 anni
89.4
-1.032
-1.14%
1 gen 1991 anni
89.729
+0.33
0.37%
1 gen 1992 anni
88.537
-1.192
-1.33%
1 gen 1993 anni
87.999
-0.538
-0.61%
1 gen 1994 anni
86.85
-1.149
-1.31%
1 gen 1995 anni
87.071
+0.222
0.26%
1 gen 1996 anni
89.112
+2.041
2.34%
1 gen 1997 anni
88.529
-0.583
-0.65%
1 gen 1998 anni
88.799
+0.27
0.3%
1 gen 1999 anni
88.738
-0.062
-0.07%
1 gen 2000 anni
88.252
-0.485
-0.55%
1 gen 2001 anni
86.978
-1.275
-1.44%
1 gen 2002 anni
86.206
-0.771
-0.89%
1 gen 2003 anni
85.224
-0.983
-1.14%
1 gen 2004 anni
83.798
-1.426
-1.67%
1 gen 2005 anni
82.021
-1.777
-2.12%
1 gen 2006 anni
80.447
-1.575
-1.92%
1 gen 2007 anni
78.547
-1.899
-2.36%
1 gen 2008 anni
77.431
-1.117
-1.42%
1 gen 2009 anni
76.143
-1.288
-1.66%
1 gen 2010 anni
74.627
-1.516
-1.99%
1 gen 2011 anni
72.948
-1.678
-2.25%
1 gen 2012 anni
72.095
-0.853
-1.17%
1 gen 2013 anni
71.897
-0.198
-0.27%
1 gen 2014 anni
73.056
+1.159
1.61%
1 gen 2015 anni
74.074
+1.018
1.39%
Classificazione dei paesi secondo i statistiche attuali per anni


Commenti: