29
/it/
it
AIzaSyAYiBZKx7MnpbEhh9jyipgxe19OcubqV5w
April 1, 2024
31826
Europe & Central Asia (excluding high income)
ECA
false
2
1
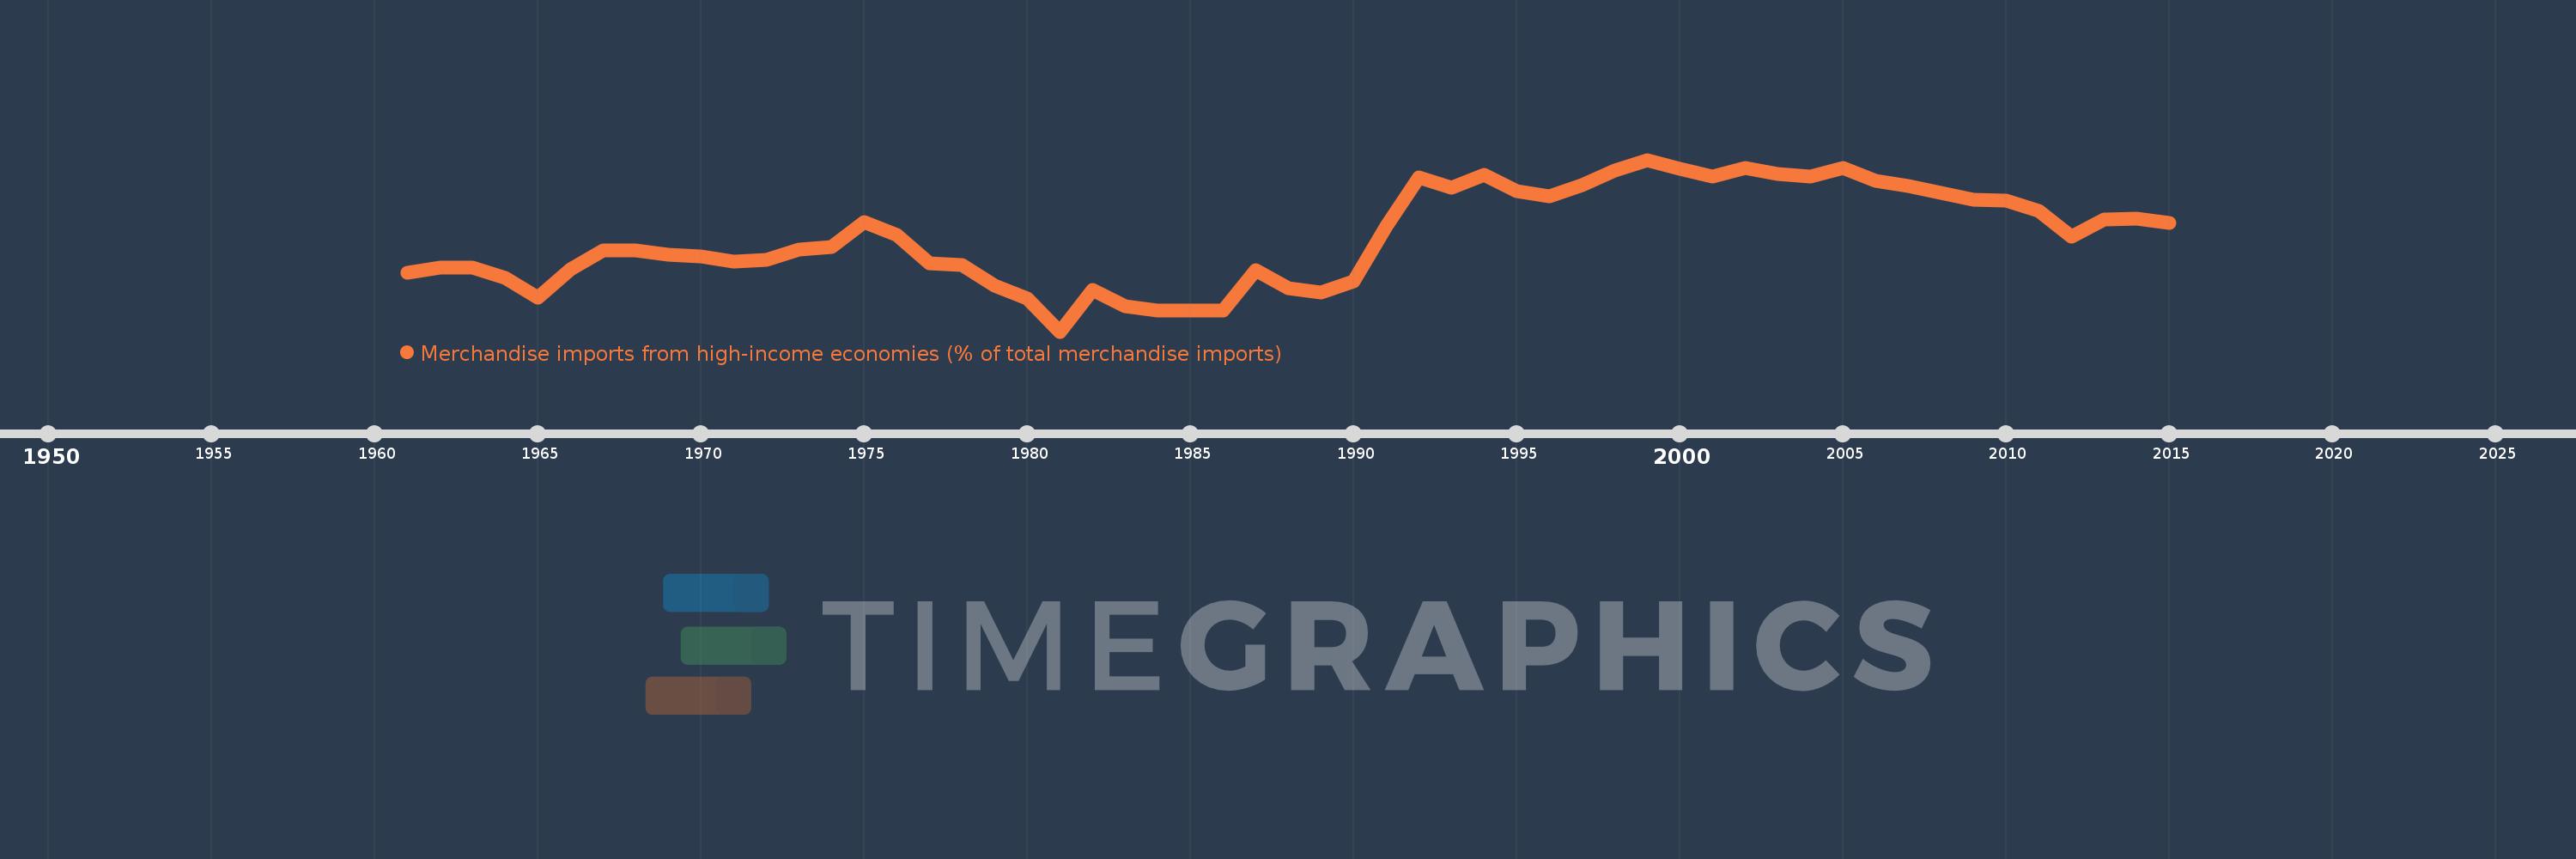
Merchandise imports from high-income economies (% of total merchandise imports)
2015,2014,2013,2012,2011,2010,2009,2008,2007,2006,2005,2004,2003,2002,2001,2000,1999,1998,1997,1996,1995,1994,1993,1992,1991,1990,1989,1988,1987,1986,1985,1984,1983,1982,1981,1980,1979,1978,1977,1976,1975,1974,1973,1972,1971,1970,1969,1968,1967,1966,1965,1964,1963,1962,1961
Queste statistiche in altri paesi:
AfghanistanAlbaniaAlgeriaAngolaAntigua and BarbudaArab WorldArgentinaArmeniaArubaAustraliaAustriaAzerbaijanBahamas, TheBahrainBangladeshBarbadosBelarusBelgiumBelizeBeninBermudaBoliviaBosnia and HerzegovinaBrazilBrunei DarussalamBulgariaBurkina FasoBurundiCabo VerdeCambodiaCameroonCanadaCaribbean small statesCentral African RepublicCentral Europe and the BalticsChadChileChinaColombiaComorosCongo, Dem. Rep.Congo, Rep.Costa RicaCote d'IvoireCroatiaCubaCyprusCzech RepublicDenmarkDjiboutiDominicaDominican RepublicEarly-demographic dividendEast Asia & PacificEast Asia & Pacific (excluding high income)East Asia & Pacific (IDA & IBRD countries)EcuadorEgypt, Arab Rep.El SalvadorEquatorial GuineaEstoniaEthiopiaEuro areaEurope & Central AsiaEurope & Central Asia (excluding high income)Europe & Central Asia (IDA & IBRD countries)European UnionFaroe IslandsFijiFinlandFragile and conflict affected situationsFranceFrench PolynesiaGabonGambia, TheGeorgiaGermanyGhanaGibraltarGreeceGreenlandGrenadaGuamGuatemalaGuineaGuinea-BissauGuyanaHaitiHeavily indebted poor countries (HIPC)High incomeHondurasHong Kong SAR, ChinaHungaryIBRD onlyIcelandIDA & IBRD totalIDA blendIDA onlyIDA totalIndiaIndonesiaIran, Islamic Rep.IraqIrelandIsraelItalyJamaicaJapanJordanKazakhstanKenyaKiribatiKorea, Dem. People’s Rep.Korea, Rep.KosovoKuwaitKyrgyz RepublicLao PDRLate-demographic dividendLatin America & Caribbean Latin America & Caribbean (excluding high income)Latin America & the Caribbean (IDA & IBRD countries)LatviaLeast developed countries: UN classificationLebanonLiberiaLibyaLithuaniaLow & middle incomeLow incomeLower middle incomeLuxembourgMacao SAR, ChinaMacedonia, FYRMadagascarMalawiMalaysiaMaldivesMaliMaltaMauritaniaMauritiusMexicoMiddle East & North AfricaMiddle East & North Africa (excluding high income)Middle East & North Africa (IDA & IBRD countries)Middle incomeMoldovaMongoliaMontenegroMoroccoMozambiqueMyanmarNauruNepalNetherlandsNew CaledoniaNew ZealandNicaraguaNigerNigeriaNorth AmericaNorwayOECD membersOmanOther small statesPacific island small statesPakistanPanamaPapua New GuineaParaguayPeruPhilippinesPolandPortugalPost-demographic dividendPre-demographic dividendQatarRomaniaRussian FederationRwandaSamoaSao Tome and PrincipeSaudi ArabiaSenegalSerbiaSeychellesSierra LeoneSingaporeSlovak RepublicSloveniaSmall statesSolomon IslandsSomaliaSouth AfricaSouth AsiaSouth Asia (IDA & IBRD)SpainSri LankaSt. Kitts and NevisSt. LuciaSt. Vincent and the GrenadinesSub-Saharan Africa Sub-Saharan Africa (excluding high income)Sub-Saharan Africa (IDA & IBRD countries)SudanSurinameSwedenSwitzerlandSyrian Arab RepublicTajikistanTanzaniaThailandTogoTongaTrinidad and TobagoTunisiaTurkeyTurkmenistanTuvaluUgandaUkraineUnited Arab EmiratesUnited KingdomUnited StatesUpper middle incomeUruguayUzbekistanVanuatuVenezuela, RBVietnamWorldYemen, Rep.ZambiaZimbabwe Linea del tempo:
Questa scala temporale mostra un grafico dal 1961 anno al 2015 anno. Europe & Central Asia (excluding high income). I dati fino ad 1960 anno non disponibili. Il numero di osservazioni attuali secondo i date: 55.
La fonte (nome):
Indicatori dello sviluppo mondiale
La fonte (organizzazione):
World Bank staff estimates based data from International Monetary Fund's Direction of Trade database.
Categorie:
Private Sector, Trade
sono stati aggiornati
23 apr 2017 anni
Indicatori delle variazioni dei valori per anni
Minima:
42.092
1 gen 1981 anni
Massimo:
76.398
1 gen 1999 anni
Alla data di osservazione
Valore
Variazione assoluta
La variazione rispetto al valore precedente
1 gen 1961 anni
53.865
+53.865
0.0%
1 gen 1962 anni
54.824
+0.96
1.78%
1 gen 1963 anni
54.925
+0.101
0.18%
1 gen 1964 anni
52.844
-2.082
-3.79%
1 gen 1965 anni
48.804
-4.04
-7.65%
1 gen 1966 anni
54.604
+5.801
11.89%
1 gen 1967 anni
58.229
+3.624
6.64%
1 gen 1968 anni
58.291
+0.063
0.11%
1 gen 1969 anni
57.45
-0.841
-1.44%
1 gen 1970 anni
57.064
-0.386
-0.67%
1 gen 1971 anni
56.021
-1.043
-1.83%
1 gen 1972 anni
56.487
+0.467
0.83%
1 gen 1973 anni
58.487
+1.999
3.54%
1 gen 1974 anni
58.923
+0.436
0.75%
1 gen 1975 anni
63.883
+4.96
8.42%
1 gen 1976 anni
61.335
-2.549
-3.99%
1 gen 1977 anni
55.804
-5.53
-9.02%
1 gen 1978 anni
55.37
-0.434
-0.78%
1 gen 1979 anni
51.336
-4.034
-7.29%
1 gen 1980 anni
48.772
-2.564
-5.0%
1 gen 1981 anni
42.092
-6.68
-13.7%
1 gen 1982 anni
50.463
+8.371
19.89%
1 gen 1983 anni
47.111
-3.352
-6.64%
1 gen 1984 anni
46.288
-0.823
-1.75%
1 gen 1985 anni
46.268
-0.02
-0.04%
1 gen 1986 anni
46.291
+0.023
0.05%
1 gen 1987 anni
54.401
+8.11
17.52%
1 gen 1988 anni
50.8
-3.6
-6.62%
1 gen 1989 anni
49.883
-0.917
-1.8%
1 gen 1990 anni
52.148
+2.265
4.54%
1 gen 1991 anni
63.138
+10.99
21.07%
1 gen 1992 anni
72.826
+9.688
15.34%
1 gen 1993 anni
70.795
-2.031
-2.79%
1 gen 1994 anni
73.424
+2.629
3.71%
1 gen 1995 anni
70.185
-3.239
-4.41%
1 gen 1996 anni
69.068
-1.117
-1.59%
1 gen 1997 anni
71.365
+2.296
3.32%
1 gen 1998 anni
74.227
+2.862
4.01%
1 gen 1999 anni
76.398
+2.171
2.93%
1 gen 2000 anni
74.553
-1.845
-2.41%
1 gen 2001 anni
73.047
-1.506
-2.02%
1 gen 2002 anni
74.73
+1.683
2.3%
1 gen 2003 anni
73.593
-1.138
-1.52%
1 gen 2004 anni
73.012
-0.581
-0.79%
1 gen 2005 anni
74.788
+1.776
2.43%
1 gen 2006 anni
72.177
-2.611
-3.49%
1 gen 2007 anni
71.107
-1.07
-1.48%
1 gen 2008 anni
69.851
-1.256
-1.77%
1 gen 2009 anni
68.417
-1.434
-2.05%
1 gen 2010 anni
68.173
-0.243
-0.36%
1 gen 2011 anni
66.173
-2.0
-2.93%
1 gen 2012 anni
61.064
-5.11
-7.72%
1 gen 2013 anni
64.475
+3.411
5.59%
1 gen 2014 anni
64.681
+0.206
0.32%
1 gen 2015 anni
63.83
-0.851
-1.32%
Classificazione dei paesi secondo i statistiche attuali per anni


Commenti: