29
/it/
it
AIzaSyAYiBZKx7MnpbEhh9jyipgxe19OcubqV5w
April 1, 2024
194522
Mauritius
MUS
true
2
1
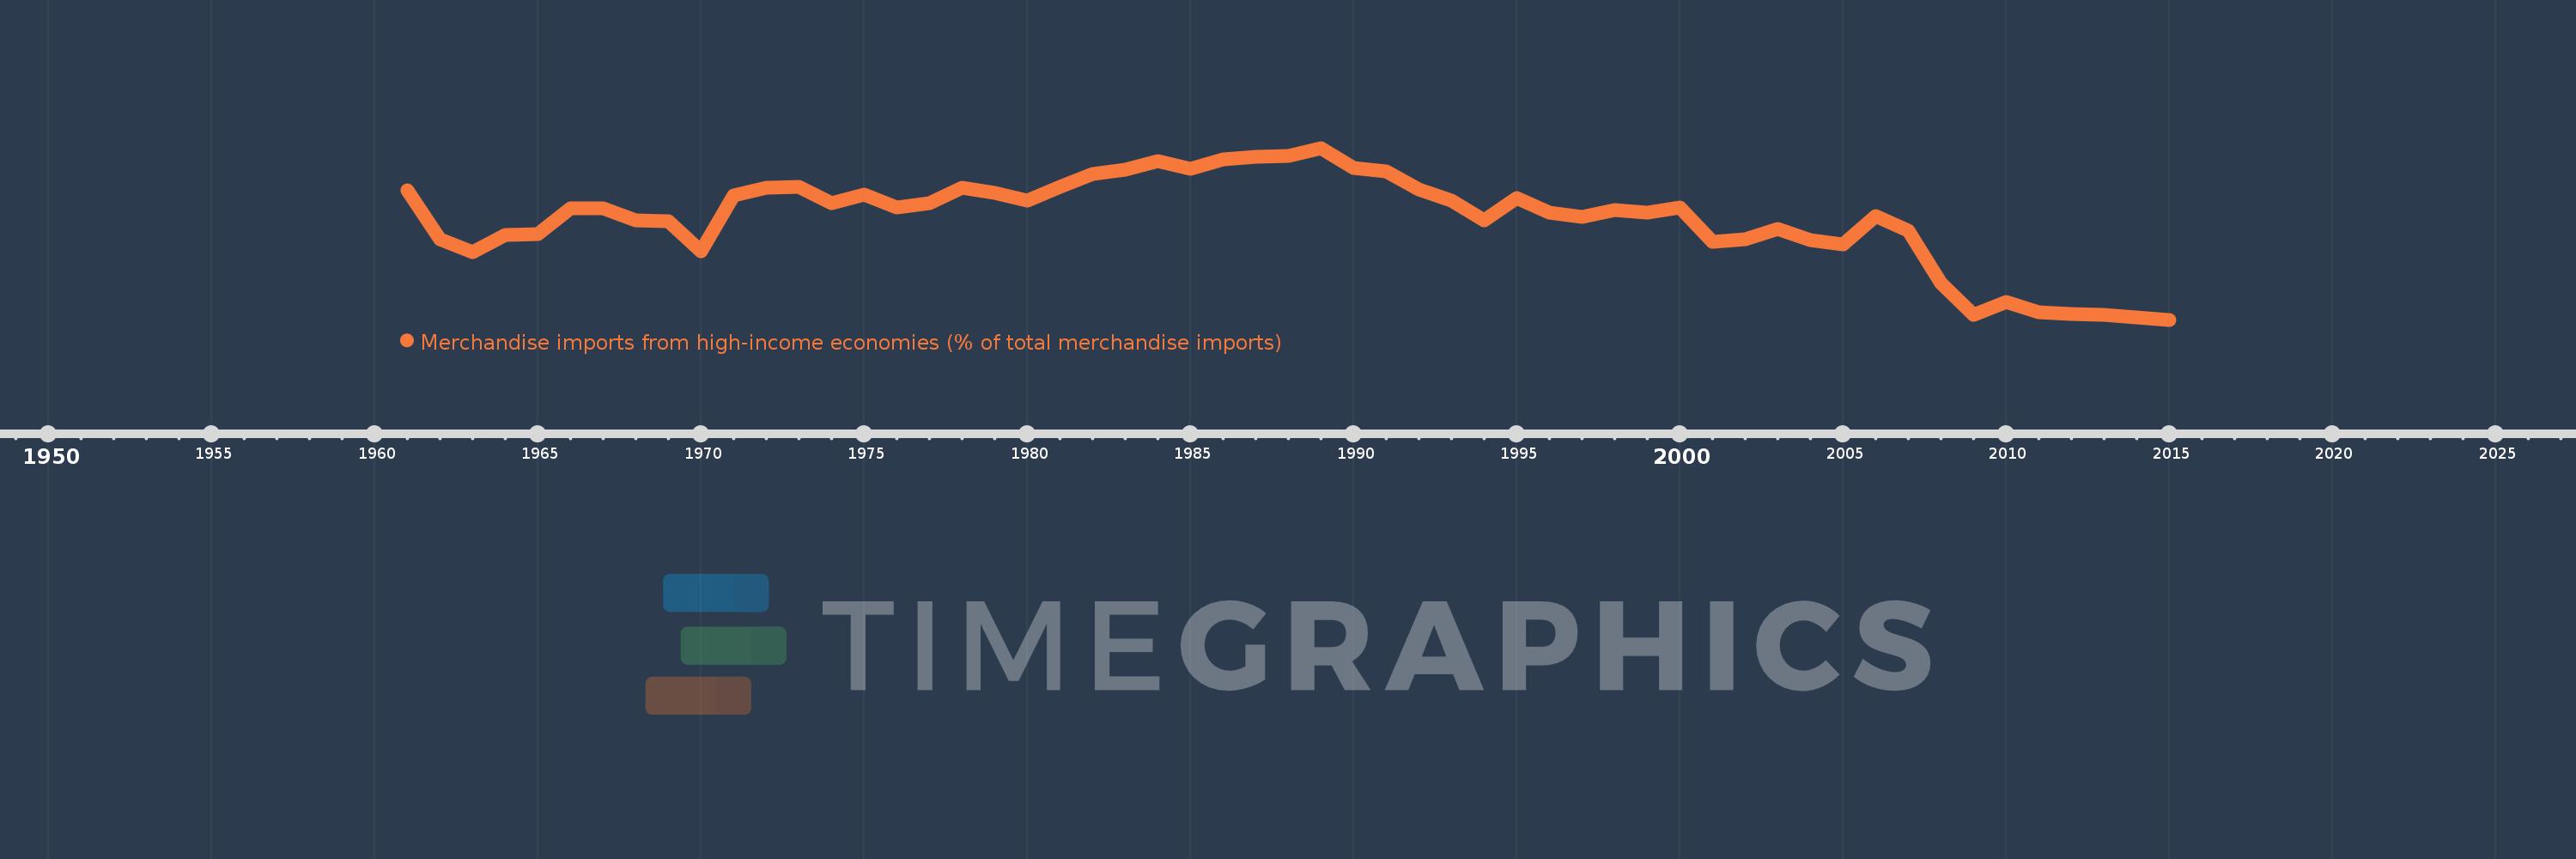
Merchandise imports from high-income economies (% of total merchandise imports)
2015,2014,2013,2012,2011,2010,2009,2008,2007,2006,2005,2004,2003,2002,2001,2000,1999,1998,1997,1996,1995,1994,1993,1992,1991,1990,1989,1988,1987,1986,1985,1984,1983,1982,1981,1980,1979,1978,1977,1976,1975,1974,1973,1972,1971,1970,1969,1968,1967,1966,1965,1964,1963,1962,1961
Queste statistiche in altri paesi:
AfghanistanAlbaniaAlgeriaAngolaAntigua and BarbudaArab WorldArgentinaArmeniaArubaAustraliaAustriaAzerbaijanBahamas, TheBahrainBangladeshBarbadosBelarusBelgiumBelizeBeninBermudaBoliviaBosnia and HerzegovinaBrazilBrunei DarussalamBulgariaBurkina FasoBurundiCabo VerdeCambodiaCameroonCanadaCaribbean small statesCentral African RepublicCentral Europe and the BalticsChadChileChinaColombiaComorosCongo, Dem. Rep.Congo, Rep.Costa RicaCote d'IvoireCroatiaCubaCyprusCzech RepublicDenmarkDjiboutiDominicaDominican RepublicEarly-demographic dividendEast Asia & PacificEast Asia & Pacific (excluding high income)East Asia & Pacific (IDA & IBRD countries)EcuadorEgypt, Arab Rep.El SalvadorEquatorial GuineaEstoniaEthiopiaEuro areaEurope & Central AsiaEurope & Central Asia (excluding high income)Europe & Central Asia (IDA & IBRD countries)European UnionFaroe IslandsFijiFinlandFragile and conflict affected situationsFranceFrench PolynesiaGabonGambia, TheGeorgiaGermanyGhanaGibraltarGreeceGreenlandGrenadaGuamGuatemalaGuineaGuinea-BissauGuyanaHaitiHeavily indebted poor countries (HIPC)High incomeHondurasHong Kong SAR, ChinaHungaryIBRD onlyIcelandIDA & IBRD totalIDA blendIDA onlyIDA totalIndiaIndonesiaIran, Islamic Rep.IraqIrelandIsraelItalyJamaicaJapanJordanKazakhstanKenyaKiribatiKorea, Dem. People’s Rep.Korea, Rep.KosovoKuwaitKyrgyz RepublicLao PDRLate-demographic dividendLatin America & Caribbean Latin America & Caribbean (excluding high income)Latin America & the Caribbean (IDA & IBRD countries)LatviaLeast developed countries: UN classificationLebanonLiberiaLibyaLithuaniaLow & middle incomeLow incomeLower middle incomeLuxembourgMacao SAR, ChinaMacedonia, FYRMadagascarMalawiMalaysiaMaldivesMaliMaltaMauritaniaMauritiusMexicoMiddle East & North AfricaMiddle East & North Africa (excluding high income)Middle East & North Africa (IDA & IBRD countries)Middle incomeMoldovaMongoliaMontenegroMoroccoMozambiqueMyanmarNauruNepalNetherlandsNew CaledoniaNew ZealandNicaraguaNigerNigeriaNorth AmericaNorwayOECD membersOmanOther small statesPacific island small statesPakistanPanamaPapua New GuineaParaguayPeruPhilippinesPolandPortugalPost-demographic dividendPre-demographic dividendQatarRomaniaRussian FederationRwandaSamoaSao Tome and PrincipeSaudi ArabiaSenegalSerbiaSeychellesSierra LeoneSingaporeSlovak RepublicSloveniaSmall statesSolomon IslandsSomaliaSouth AfricaSouth AsiaSouth Asia (IDA & IBRD)SpainSri LankaSt. Kitts and NevisSt. LuciaSt. Vincent and the GrenadinesSub-Saharan Africa Sub-Saharan Africa (excluding high income)Sub-Saharan Africa (IDA & IBRD countries)SudanSurinameSwedenSwitzerlandSyrian Arab RepublicTajikistanTanzaniaThailandTogoTongaTrinidad and TobagoTunisiaTurkeyTurkmenistanTuvaluUgandaUkraineUnited Arab EmiratesUnited KingdomUnited StatesUpper middle incomeUruguayUzbekistanVanuatuVenezuela, RBVietnamWorldYemen, Rep.ZambiaZimbabwe Linea del tempo:
Questa scala temporale mostra un grafico dal 1961 anno al 2015 anno. Mauritius. I dati fino ad 1960 anno non disponibili. Il numero di osservazioni attuali secondo i date: 55.
La fonte (nome):
Indicatori dello sviluppo mondiale
La fonte (organizzazione):
World Bank staff estimates based data from International Monetary Fund's Direction of Trade database.
Categorie:
Private Sector, Trade
sono stati aggiornati
23 apr 2017 anni
Indicatori delle variazioni dei valori per anni
Minima:
40.186
1 gen 2015 anni
Massimo:
75.704
1 gen 1989 anni
Alla data di osservazione
Valore
Variazione assoluta
La variazione rispetto al valore precedente
1 gen 1961 anni
66.959
+66.959
0.0%
1 gen 1962 anni
56.753
-10.206
-15.24%
1 gen 1963 anni
54.211
-2.541
-4.48%
1 gen 1964 anni
57.709
+3.498
6.45%
1 gen 1965 anni
57.895
+0.185
0.32%
1 gen 1966 anni
63.2
+5.305
9.16%
1 gen 1967 anni
63.135
-0.065
-0.1%
1 gen 1968 anni
60.795
-2.34
-3.71%
1 gen 1969 anni
60.541
-0.253
-0.42%
1 gen 1970 anni
54.308
-6.234
-10.3%
1 gen 1971 anni
65.811
+11.503
21.18%
1 gen 1972 anni
67.44
+1.629
2.48%
1 gen 1973 anni
67.66
+0.22
0.33%
1 gen 1974 anni
64.373
-3.287
-4.86%
1 gen 1975 anni
66.029
+1.657
2.57%
1 gen 1976 anni
63.416
-2.614
-3.96%
1 gen 1977 anni
64.357
+0.941
1.48%
1 gen 1978 anni
67.461
+3.104
4.82%
1 gen 1979 anni
66.366
-1.095
-1.62%
1 gen 1980 anni
64.808
-1.558
-2.35%
1 gen 1981 anni
67.715
+2.907
4.49%
1 gen 1982 anni
70.338
+2.623
3.87%
1 gen 1983 anni
71.292
+0.954
1.36%
1 gen 1984 anni
72.99
+1.698
2.38%
1 gen 1985 anni
71.435
-1.556
-2.13%
1 gen 1986 anni
73.407
+1.972
2.76%
1 gen 1987 anni
73.926
+0.519
0.71%
1 gen 1988 anni
74.049
+0.123
0.17%
1 gen 1989 anni
75.704
+1.655
2.23%
1 gen 1990 anni
71.532
-4.172
-5.51%
1 gen 1991 anni
70.789
-0.743
-1.04%
1 gen 1992 anni
67.16
-3.628
-5.13%
1 gen 1993 anni
64.905
-2.256
-3.36%
1 gen 1994 anni
60.791
-4.114
-6.34%
1 gen 1995 anni
65.295
+4.504
7.41%
1 gen 1996 anni
62.32
-2.975
-4.56%
1 gen 1997 anni
61.447
-0.873
-1.4%
1 gen 1998 anni
62.94
+1.493
2.43%
1 gen 1999 anni
62.379
-0.561
-0.89%
1 gen 2000 anni
63.385
+1.006
1.61%
1 gen 2001 anni
56.306
-7.079
-11.17%
1 gen 2002 anni
56.903
+0.597
1.06%
1 gen 2003 anni
58.878
+1.975
3.47%
1 gen 2004 anni
56.705
-2.174
-3.69%
1 gen 2005 anni
55.805
-0.9
-1.59%
1 gen 2006 anni
61.645
+5.841
10.47%
1 gen 2007 anni
58.548
-3.098
-5.02%
1 gen 2008 anni
47.742
-10.806
-18.46%
1 gen 2009 anni
41.27
-6.472
-13.56%
1 gen 2010 anni
43.917
+2.647
6.41%
1 gen 2011 anni
41.695
-2.222
-5.06%
1 gen 2012 anni
41.378
-0.317
-0.76%
1 gen 2013 anni
41.191
-0.187
-0.45%
1 gen 2014 anni
40.67
-0.522
-1.27%
1 gen 2015 anni
40.186
-0.483
-1.19%
Classificazione dei paesi secondo i statistiche attuali per anni


Commenti: