29
/it/
it
AIzaSyAYiBZKx7MnpbEhh9jyipgxe19OcubqV5w
April 1, 2024
213247
Nigeria
NGA
true
2
1
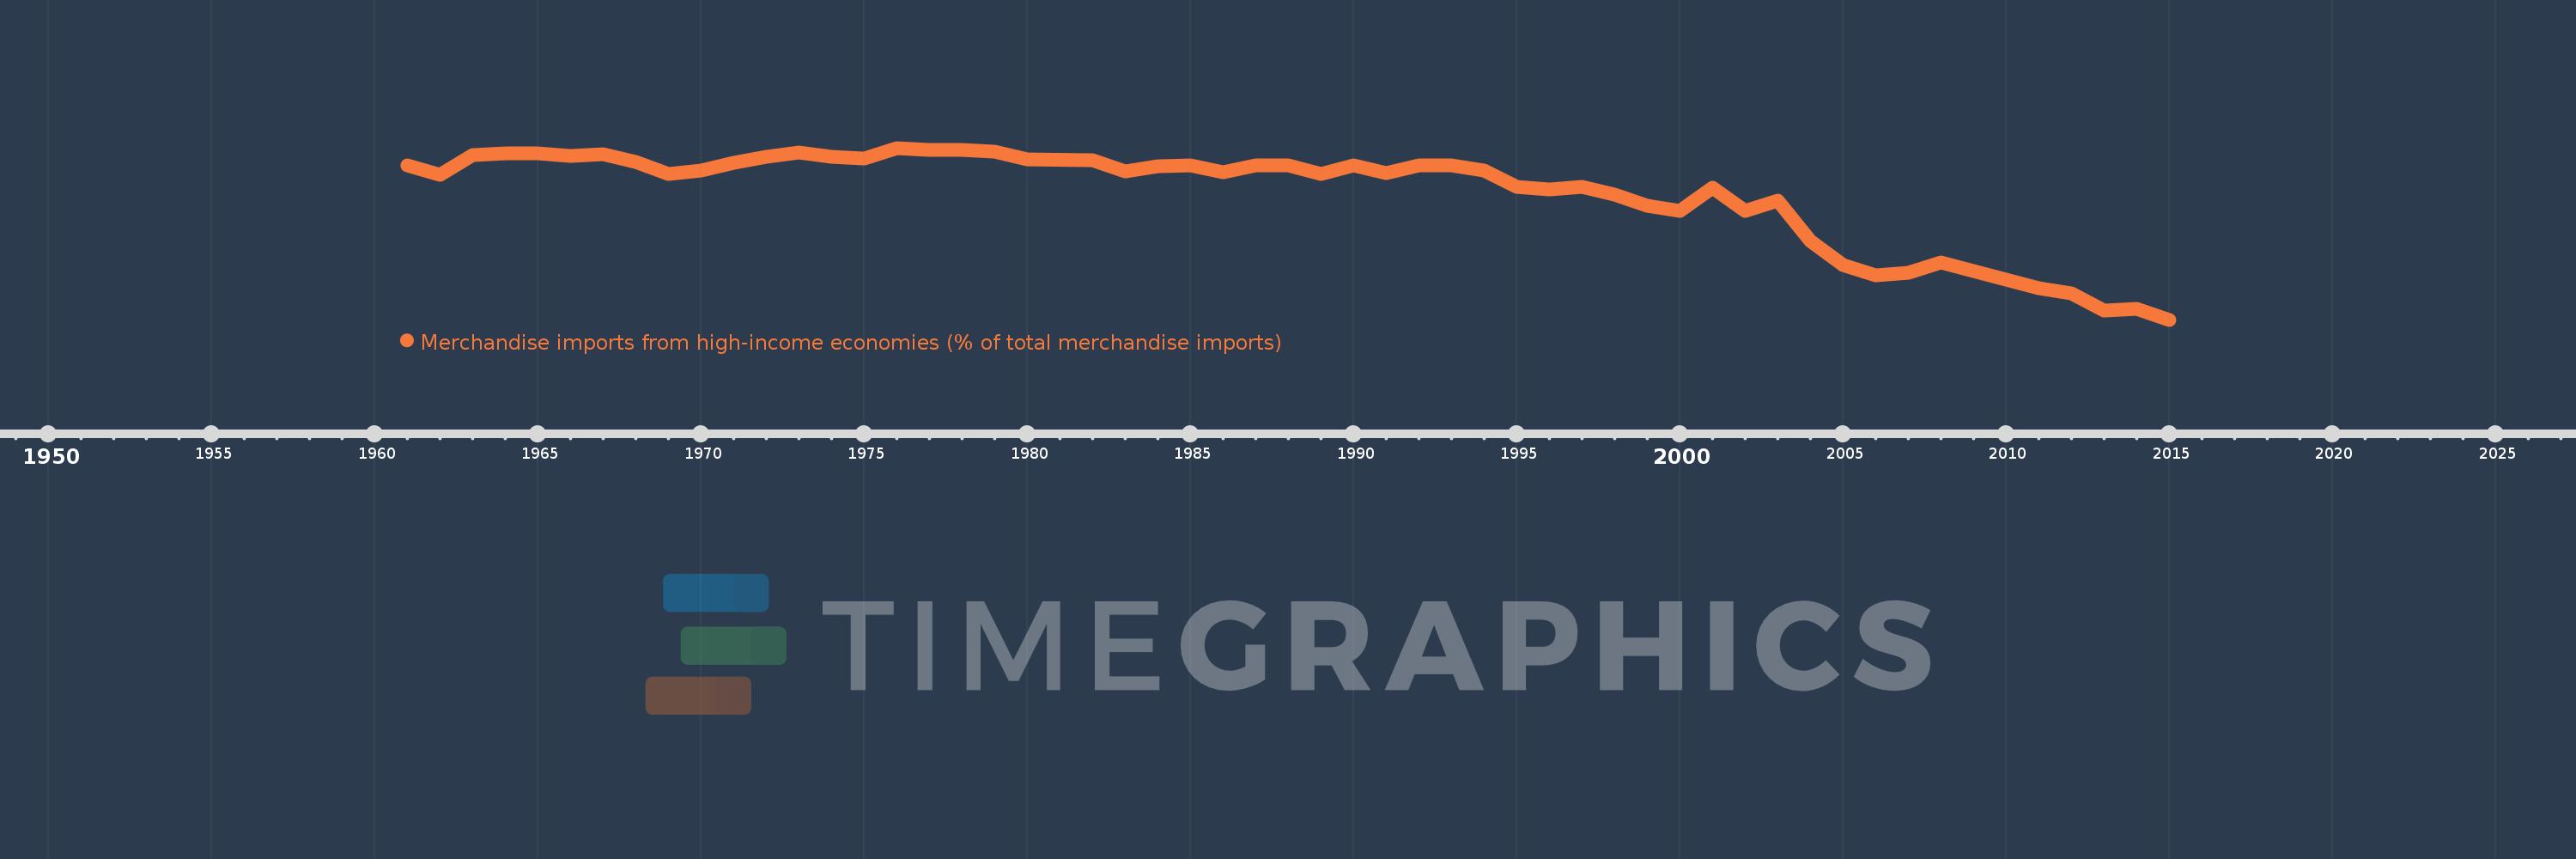
Merchandise imports from high-income economies (% of total merchandise imports)
2015,2014,2013,2012,2011,2010,2009,2008,2007,2006,2005,2004,2003,2002,2001,2000,1999,1998,1997,1996,1995,1994,1993,1992,1991,1990,1989,1988,1987,1986,1985,1984,1983,1982,1980,1979,1978,1977,1976,1975,1974,1973,1972,1971,1970,1969,1968,1967,1966,1965,1964,1963,1962,1961
Queste statistiche in altri paesi:
AfghanistanAlbaniaAlgeriaAngolaAntigua and BarbudaArab WorldArgentinaArmeniaArubaAustraliaAustriaAzerbaijanBahamas, TheBahrainBangladeshBarbadosBelarusBelgiumBelizeBeninBermudaBoliviaBosnia and HerzegovinaBrazilBrunei DarussalamBulgariaBurkina FasoBurundiCabo VerdeCambodiaCameroonCanadaCaribbean small statesCentral African RepublicCentral Europe and the BalticsChadChileChinaColombiaComorosCongo, Dem. Rep.Congo, Rep.Costa RicaCote d'IvoireCroatiaCubaCyprusCzech RepublicDenmarkDjiboutiDominicaDominican RepublicEarly-demographic dividendEast Asia & PacificEast Asia & Pacific (excluding high income)East Asia & Pacific (IDA & IBRD countries)EcuadorEgypt, Arab Rep.El SalvadorEquatorial GuineaEstoniaEthiopiaEuro areaEurope & Central AsiaEurope & Central Asia (excluding high income)Europe & Central Asia (IDA & IBRD countries)European UnionFaroe IslandsFijiFinlandFragile and conflict affected situationsFranceFrench PolynesiaGabonGambia, TheGeorgiaGermanyGhanaGibraltarGreeceGreenlandGrenadaGuamGuatemalaGuineaGuinea-BissauGuyanaHaitiHeavily indebted poor countries (HIPC)High incomeHondurasHong Kong SAR, ChinaHungaryIBRD onlyIcelandIDA & IBRD totalIDA blendIDA onlyIDA totalIndiaIndonesiaIran, Islamic Rep.IraqIrelandIsraelItalyJamaicaJapanJordanKazakhstanKenyaKiribatiKorea, Dem. People’s Rep.Korea, Rep.KosovoKuwaitKyrgyz RepublicLao PDRLate-demographic dividendLatin America & Caribbean Latin America & Caribbean (excluding high income)Latin America & the Caribbean (IDA & IBRD countries)LatviaLeast developed countries: UN classificationLebanonLiberiaLibyaLithuaniaLow & middle incomeLow incomeLower middle incomeLuxembourgMacao SAR, ChinaMacedonia, FYRMadagascarMalawiMalaysiaMaldivesMaliMaltaMauritaniaMauritiusMexicoMiddle East & North AfricaMiddle East & North Africa (excluding high income)Middle East & North Africa (IDA & IBRD countries)Middle incomeMoldovaMongoliaMontenegroMoroccoMozambiqueMyanmarNauruNepalNetherlandsNew CaledoniaNew ZealandNicaraguaNigerNigeriaNorth AmericaNorwayOECD membersOmanOther small statesPacific island small statesPakistanPanamaPapua New GuineaParaguayPeruPhilippinesPolandPortugalPost-demographic dividendPre-demographic dividendQatarRomaniaRussian FederationRwandaSamoaSao Tome and PrincipeSaudi ArabiaSenegalSerbiaSeychellesSierra LeoneSingaporeSlovak RepublicSloveniaSmall statesSolomon IslandsSomaliaSouth AfricaSouth AsiaSouth Asia (IDA & IBRD)SpainSri LankaSt. Kitts and NevisSt. LuciaSt. Vincent and the GrenadinesSub-Saharan Africa Sub-Saharan Africa (excluding high income)Sub-Saharan Africa (IDA & IBRD countries)SudanSurinameSwedenSwitzerlandSyrian Arab RepublicTajikistanTanzaniaThailandTogoTongaTrinidad and TobagoTunisiaTurkeyTurkmenistanTuvaluUgandaUkraineUnited Arab EmiratesUnited KingdomUnited StatesUpper middle incomeUruguayUzbekistanVanuatuVenezuela, RBVietnamWorldYemen, Rep.ZambiaZimbabwe Linea del tempo:
Questa scala temporale mostra un grafico dal 1961 anno al 2015 anno. Nigeria. I dati fino ad 1960 anno non disponibili. Il numero di osservazioni attuali secondo i date: 54.
La fonte (nome):
Indicatori dello sviluppo mondiale
La fonte (organizzazione):
World Bank staff estimates based data from International Monetary Fund's Direction of Trade database.
Categorie:
Private Sector, Trade
sono stati aggiornati
23 apr 2017 anni
Indicatori delle variazioni dei valori per anni
Minima:
41.802
1 gen 2015 anni
Massimo:
90.061
1 gen 1976 anni
Alla data di osservazione
Valore
Variazione assoluta
La variazione rispetto al valore precedente
1 gen 1961 anni
85.283
+85.283
0.0%
1 gen 1962 anni
82.425
-2.858
-3.35%
1 gen 1963 anni
88.139
+5.714
6.93%
1 gen 1964 anni
88.45
+0.311
0.35%
1 gen 1965 anni
88.439
-0.011
-0.01%
1 gen 1966 anni
87.774
-0.665
-0.75%
1 gen 1967 anni
88.239
+0.465
0.53%
1 gen 1968 anni
86.015
-2.223
-2.52%
1 gen 1969 anni
82.731
-3.284
-3.82%
1 gen 1970 anni
83.755
+1.024
1.24%
1 gen 1971 anni
85.954
+2.199
2.63%
1 gen 1972 anni
87.662
+1.708
1.99%
1 gen 1973 anni
88.743
+1.08
1.23%
1 gen 1974 anni
87.669
-1.073
-1.21%
1 gen 1975 anni
87.145
-0.524
-0.6%
1 gen 1976 anni
90.061
+2.916
3.35%
1 gen 1977 anni
89.41
-0.651
-0.72%
1 gen 1978 anni
89.509
+0.099
0.11%
1 gen 1979 anni
89.135
-0.374
-0.42%
1 gen 1980 anni
86.814
-2.321
-2.6%
1 gen 1982 anni
86.647
-0.167
-0.19%
1 gen 1983 anni
83.567
-3.08
-3.55%
1 gen 1984 anni
84.88
+1.313
1.57%
1 gen 1985 anni
85.266
+0.386
0.46%
1 gen 1986 anni
83.15
-2.116
-2.48%
1 gen 1987 anni
85.124
+1.974
2.37%
1 gen 1988 anni
85.124
0.0
0.0%
1 gen 1989 anni
82.799
-2.325
-2.73%
1 gen 1990 anni
85.248
+2.449
2.96%
1 gen 1991 anni
83.1
-2.147
-2.52%
1 gen 1992 anni
85.162
+2.061
2.48%
1 gen 1993 anni
85.14
-0.022
-0.03%
1 gen 1994 anni
83.697
-1.443
-1.69%
1 gen 1995 anni
79.233
-4.464
-5.33%
1 gen 1996 anni
78.319
-0.914
-1.15%
1 gen 1997 anni
79.121
+0.802
1.02%
1 gen 1998 anni
76.959
-2.162
-2.73%
1 gen 1999 anni
73.715
-3.244
-4.22%
1 gen 2000 anni
72.32
-1.394
-1.89%
1 gen 2001 anni
78.903
+6.583
9.1%
1 gen 2002 anni
72.359
-6.544
-8.29%
1 gen 2003 anni
75.233
+2.874
3.97%
1 gen 2004 anni
63.9
-11.334
-15.06%
1 gen 2005 anni
57.216
-6.683
-10.46%
1 gen 2006 anni
54.357
-2.86
-5.0%
1 gen 2007 anni
55.089
+0.732
1.35%
1 gen 2008 anni
57.803
+2.714
4.93%
1 gen 2009 anni
55.38
-2.423
-4.19%
1 gen 2010 anni
53.119
-2.261
-4.08%
1 gen 2011 anni
50.765
-2.354
-4.43%
1 gen 2012 anni
49.276
-1.489
-2.93%
1 gen 2013 anni
44.394
-4.881
-9.91%
1 gen 2014 anni
44.896
+0.502
1.13%
1 gen 2015 anni
41.802
-3.095
-6.89%
Classificazione dei paesi secondo i statistiche attuali per anni


Commenti: