29
/it/
it
AIzaSyAYiBZKx7MnpbEhh9jyipgxe19OcubqV5w
April 1, 2024
112547
Costa Rica
CRI
true
2
1
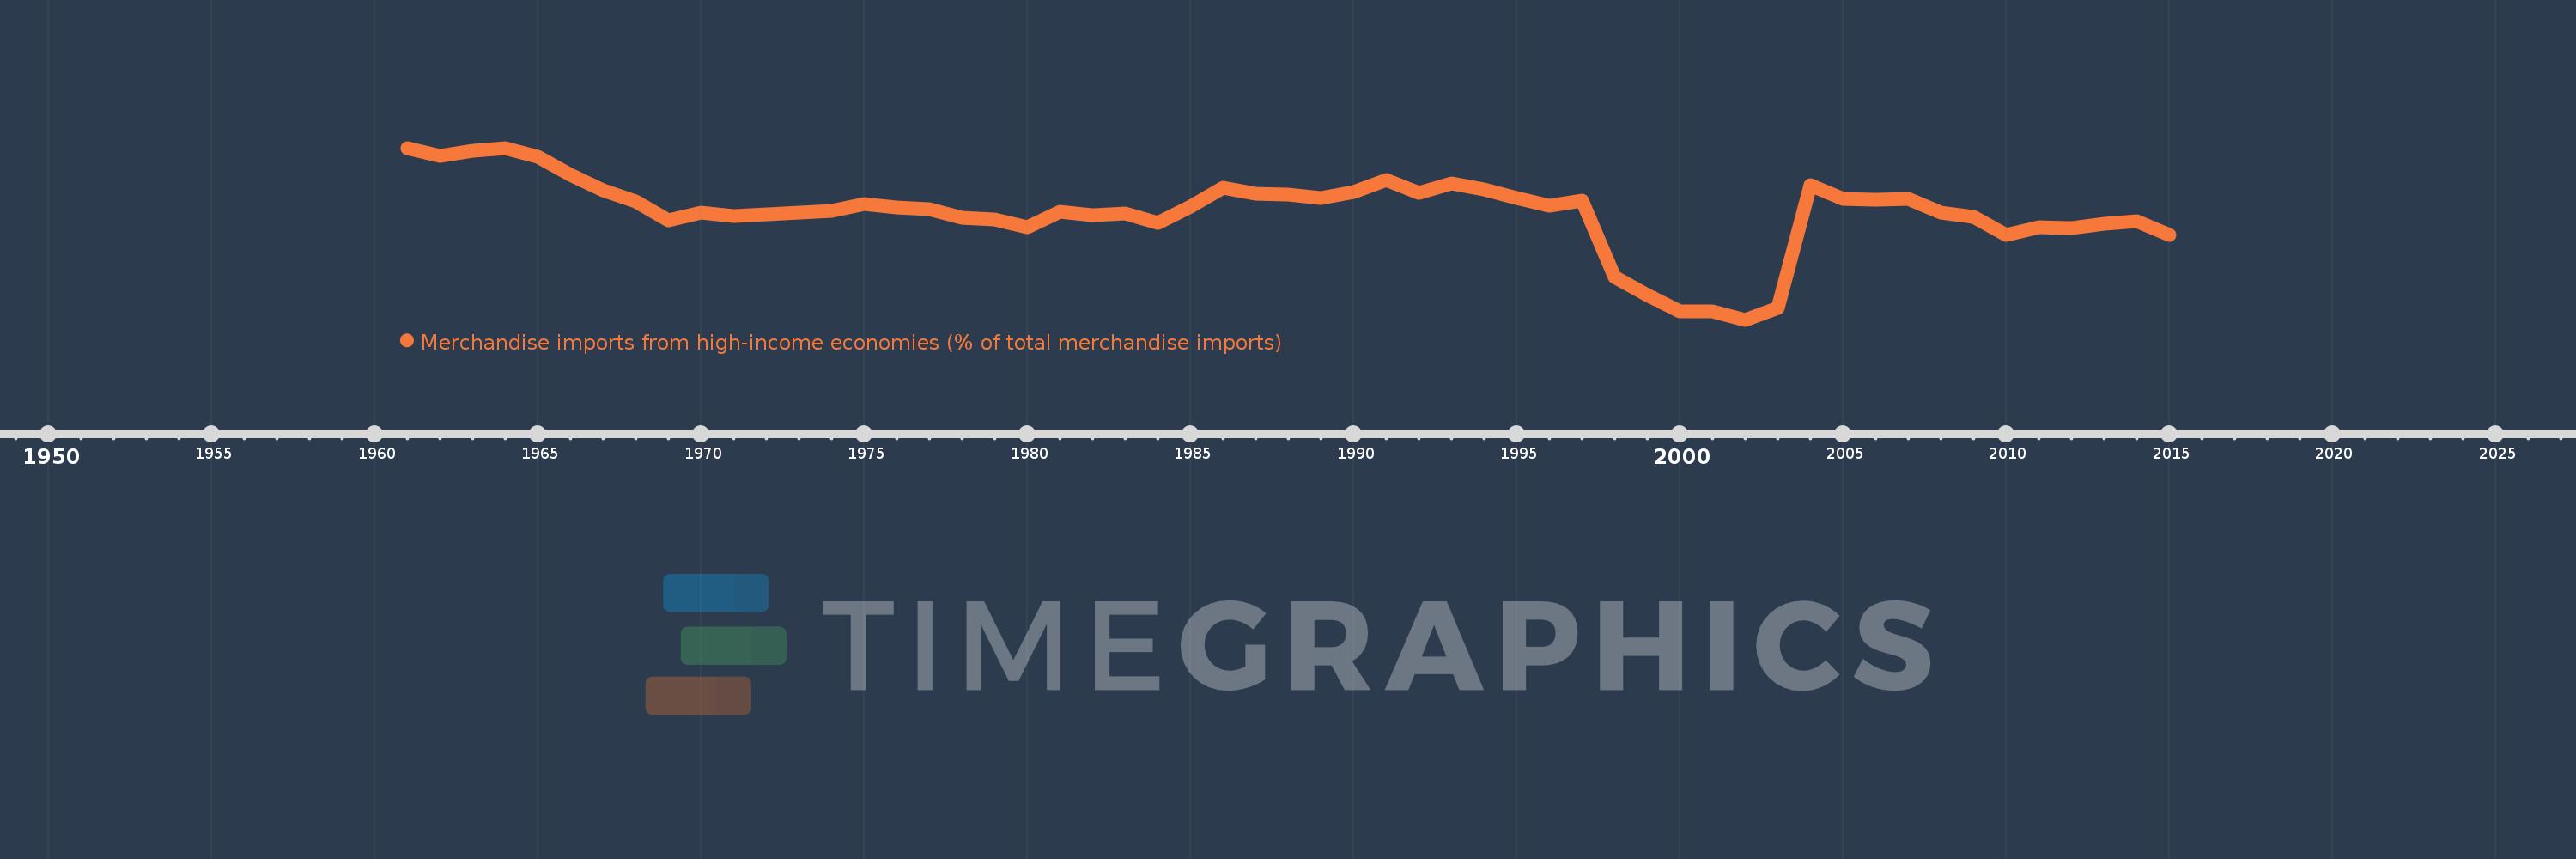
Merchandise imports from high-income economies (% of total merchandise imports)
2015,2014,2013,2012,2011,2010,2009,2008,2007,2006,2005,2004,2003,2002,2001,2000,1999,1998,1997,1996,1995,1994,1993,1992,1991,1990,1989,1988,1987,1986,1985,1984,1983,1982,1981,1980,1979,1978,1977,1976,1975,1974,1973,1972,1971,1970,1969,1968,1967,1966,1965,1964,1963,1962,1961
Queste statistiche in altri paesi:
AfghanistanAlbaniaAlgeriaAngolaAntigua and BarbudaArab WorldArgentinaArmeniaArubaAustraliaAustriaAzerbaijanBahamas, TheBahrainBangladeshBarbadosBelarusBelgiumBelizeBeninBermudaBoliviaBosnia and HerzegovinaBrazilBrunei DarussalamBulgariaBurkina FasoBurundiCabo VerdeCambodiaCameroonCanadaCaribbean small statesCentral African RepublicCentral Europe and the BalticsChadChileChinaColombiaComorosCongo, Dem. Rep.Congo, Rep.Costa RicaCote d'IvoireCroatiaCubaCyprusCzech RepublicDenmarkDjiboutiDominicaDominican RepublicEarly-demographic dividendEast Asia & PacificEast Asia & Pacific (excluding high income)East Asia & Pacific (IDA & IBRD countries)EcuadorEgypt, Arab Rep.El SalvadorEquatorial GuineaEstoniaEthiopiaEuro areaEurope & Central AsiaEurope & Central Asia (excluding high income)Europe & Central Asia (IDA & IBRD countries)European UnionFaroe IslandsFijiFinlandFragile and conflict affected situationsFranceFrench PolynesiaGabonGambia, TheGeorgiaGermanyGhanaGibraltarGreeceGreenlandGrenadaGuamGuatemalaGuineaGuinea-BissauGuyanaHaitiHeavily indebted poor countries (HIPC)High incomeHondurasHong Kong SAR, ChinaHungaryIBRD onlyIcelandIDA & IBRD totalIDA blendIDA onlyIDA totalIndiaIndonesiaIran, Islamic Rep.IraqIrelandIsraelItalyJamaicaJapanJordanKazakhstanKenyaKiribatiKorea, Dem. People’s Rep.Korea, Rep.KosovoKuwaitKyrgyz RepublicLao PDRLate-demographic dividendLatin America & Caribbean Latin America & Caribbean (excluding high income)Latin America & the Caribbean (IDA & IBRD countries)LatviaLeast developed countries: UN classificationLebanonLiberiaLibyaLithuaniaLow & middle incomeLow incomeLower middle incomeLuxembourgMacao SAR, ChinaMacedonia, FYRMadagascarMalawiMalaysiaMaldivesMaliMaltaMauritaniaMauritiusMexicoMiddle East & North AfricaMiddle East & North Africa (excluding high income)Middle East & North Africa (IDA & IBRD countries)Middle incomeMoldovaMongoliaMontenegroMoroccoMozambiqueMyanmarNauruNepalNetherlandsNew CaledoniaNew ZealandNicaraguaNigerNigeriaNorth AmericaNorwayOECD membersOmanOther small statesPacific island small statesPakistanPanamaPapua New GuineaParaguayPeruPhilippinesPolandPortugalPost-demographic dividendPre-demographic dividendQatarRomaniaRussian FederationRwandaSamoaSao Tome and PrincipeSaudi ArabiaSenegalSerbiaSeychellesSierra LeoneSingaporeSlovak RepublicSloveniaSmall statesSolomon IslandsSomaliaSouth AfricaSouth AsiaSouth Asia (IDA & IBRD)SpainSri LankaSt. Kitts and NevisSt. LuciaSt. Vincent and the GrenadinesSub-Saharan Africa Sub-Saharan Africa (excluding high income)Sub-Saharan Africa (IDA & IBRD countries)SudanSurinameSwedenSwitzerlandSyrian Arab RepublicTajikistanTanzaniaThailandTogoTongaTrinidad and TobagoTunisiaTurkeyTurkmenistanTuvaluUgandaUkraineUnited Arab EmiratesUnited KingdomUnited StatesUpper middle incomeUruguayUzbekistanVanuatuVenezuela, RBVietnamWorldYemen, Rep.ZambiaZimbabwe Linea del tempo:
Questa scala temporale mostra un grafico dal 1961 anno al 2015 anno. Costa Rica. I dati fino ad 1960 anno non disponibili. Il numero di osservazioni attuali secondo i date: 55.
La fonte (nome):
Indicatori dello sviluppo mondiale
La fonte (organizzazione):
World Bank staff estimates based data from International Monetary Fund's Direction of Trade database.
Categorie:
Private Sector, Trade
sono stati aggiornati
23 apr 2017 anni
Indicatori delle variazioni dei valori per anni
Minima:
43.533
1 gen 2002 anni
Massimo:
88.353
1 gen 1961 anni
Alla data di osservazione
Valore
Variazione assoluta
La variazione rispetto al valore precedente
1 gen 1961 anni
88.353
+88.353
0.0%
1 gen 1962 anni
86.278
-2.075
-2.35%
1 gen 1963 anni
87.578
+1.3
1.51%
1 gen 1964 anni
88.283
+0.705
0.8%
1 gen 1965 anni
85.974
-2.309
-2.62%
1 gen 1966 anni
81.246
-4.727
-5.5%
1 gen 1967 anni
77.372
-3.874
-4.77%
1 gen 1968 anni
74.432
-2.94
-3.8%
1 gen 1969 anni
69.5
-4.933
-6.63%
1 gen 1970 anni
71.543
+2.043
2.94%
1 gen 1971 anni
70.578
-0.965
-1.35%
1 gen 1972 anni
71.031
+0.453
0.64%
1 gen 1973 anni
71.559
+0.528
0.74%
1 gen 1974 anni
71.939
+0.38
0.53%
1 gen 1975 anni
73.79
+1.851
2.57%
1 gen 1976 anni
72.891
-0.899
-1.22%
1 gen 1977 anni
72.374
-0.517
-0.71%
1 gen 1978 anni
70.135
-2.239
-3.09%
1 gen 1979 anni
69.75
-0.384
-0.55%
1 gen 1980 anni
67.587
-2.164
-3.1%
1 gen 1981 anni
71.662
+4.075
6.03%
1 gen 1982 anni
70.889
-0.774
-1.08%
1 gen 1983 anni
71.253
+0.364
0.51%
1 gen 1984 anni
68.74
-2.512
-3.53%
1 gen 1985 anni
73.126
+4.386
6.38%
1 gen 1986 anni
77.944
+4.817
6.59%
1 gen 1987 anni
76.299
-1.645
-2.11%
1 gen 1988 anni
76.232
-0.066
-0.09%
1 gen 1989 anni
75.283
-0.949
-1.25%
1 gen 1990 anni
76.815
+1.532
2.03%
1 gen 1991 anni
80.031
+3.217
4.19%
1 gen 1992 anni
76.678
-3.354
-4.19%
1 gen 1993 anni
79.076
+2.398
3.13%
1 gen 1994 anni
77.524
-1.552
-1.96%
1 gen 1995 anni
75.212
-2.311
-2.98%
1 gen 1996 anni
73.217
-1.996
-2.65%
1 gen 1997 anni
74.577
+1.36
1.86%
1 gen 1998 anni
54.695
-19.881
-26.66%
1 gen 1999 anni
49.863
-4.832
-8.83%
1 gen 2000 anni
45.753
-4.11
-8.24%
1 gen 2001 anni
45.648
-0.105
-0.23%
1 gen 2002 anni
43.533
-2.115
-4.63%
1 gen 2003 anni
46.554
+3.021
6.94%
1 gen 2004 anni
78.56
+32.006
68.75%
1 gen 2005 anni
75.175
-3.386
-4.31%
1 gen 2006 anni
74.758
-0.416
-0.55%
1 gen 2007 anni
75.172
+0.414
0.55%
1 gen 2008 anni
71.413
-3.759
-5.0%
1 gen 2009 anni
70.461
-0.953
-1.33%
1 gen 2010 anni
65.659
-4.801
-6.81%
1 gen 2011 anni
67.662
+2.003
3.05%
1 gen 2012 anni
67.401
-0.261
-0.39%
1 gen 2013 anni
68.63
+1.229
1.82%
1 gen 2014 anni
69.21
+0.581
0.85%
1 gen 2015 anni
65.746
-3.465
-5.01%
Classificazione dei paesi secondo i statistiche attuali per anni


Commenti: