29
/it/
it
AIzaSyAYiBZKx7MnpbEhh9jyipgxe19OcubqV5w
April 1, 2024
268280
Tunisia
TUN
true
2
1
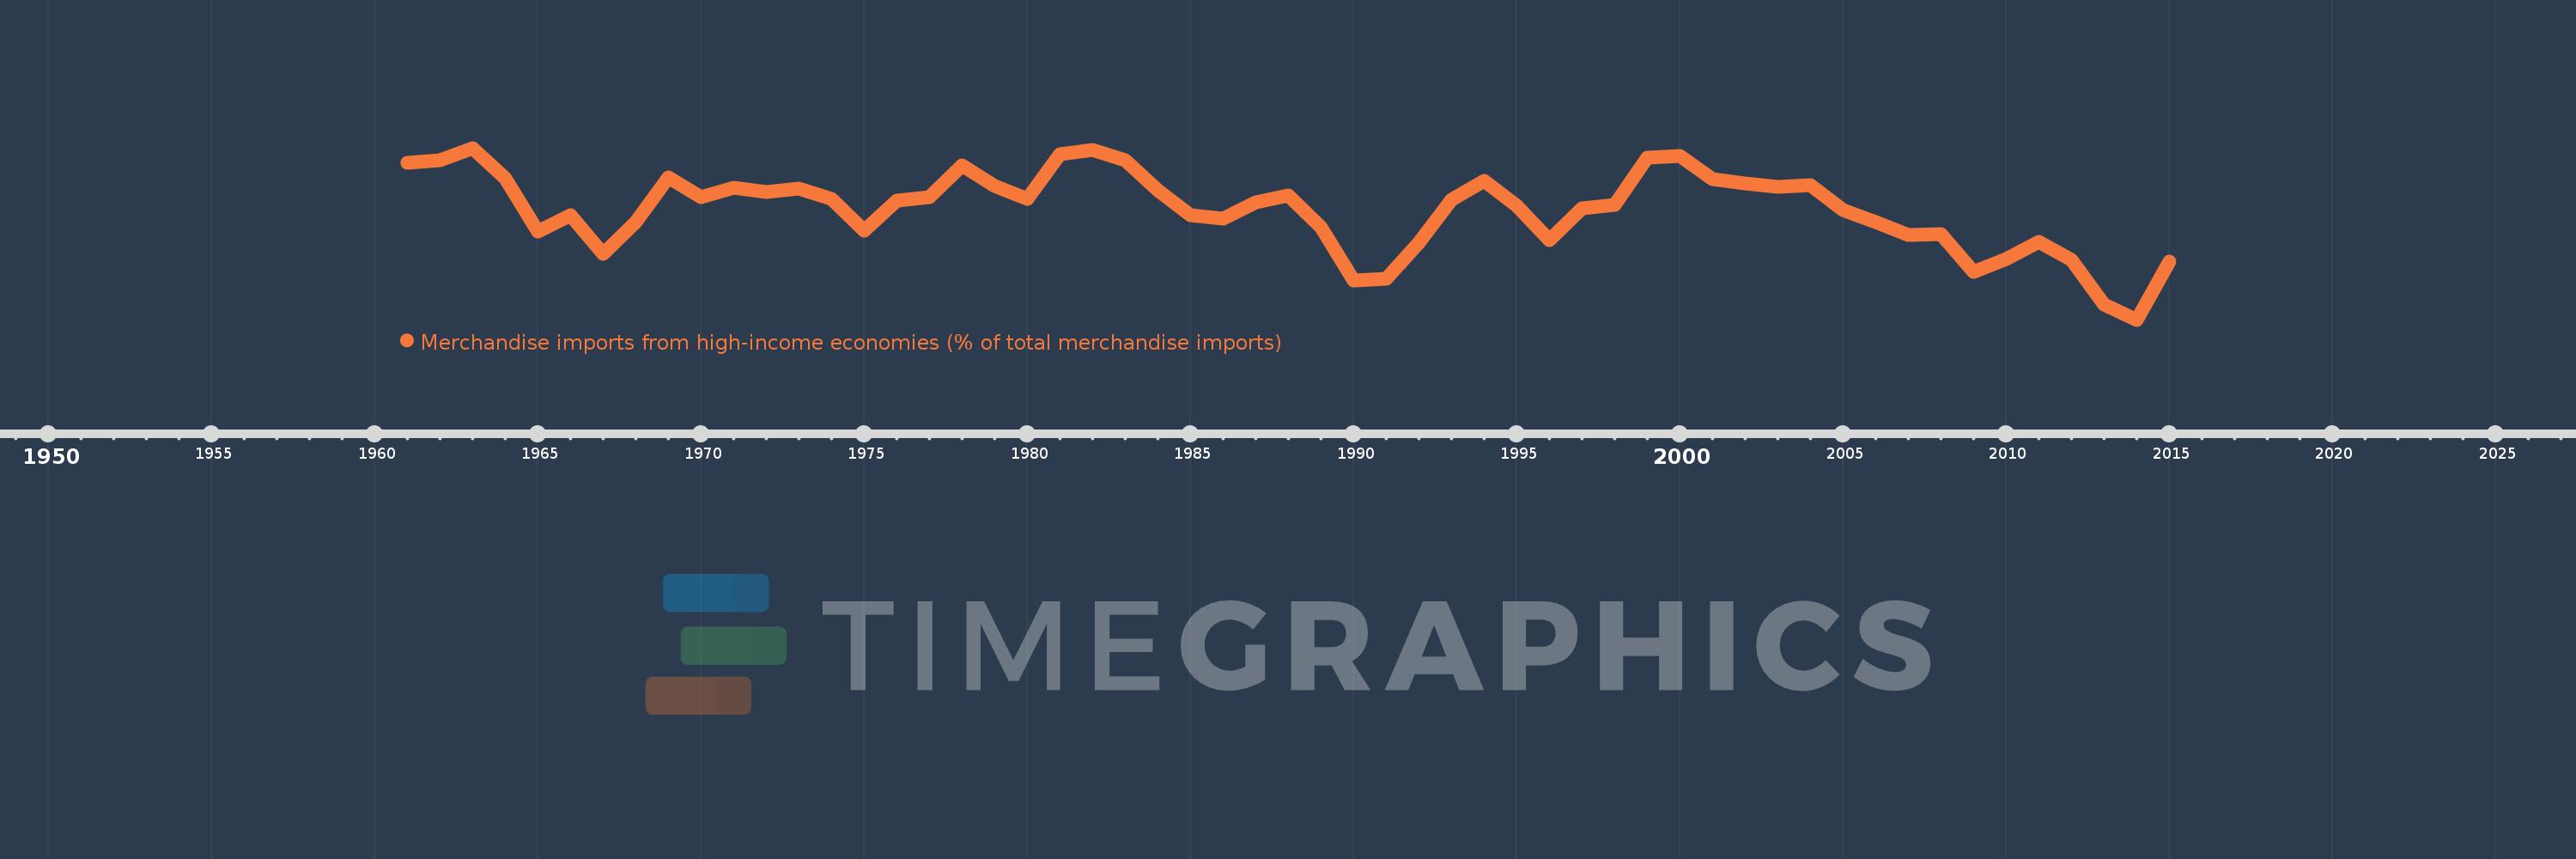
Merchandise imports from high-income economies (% of total merchandise imports)
2015,2014,2013,2012,2011,2010,2009,2008,2007,2006,2005,2004,2003,2002,2001,2000,1999,1998,1997,1996,1995,1994,1993,1992,1991,1990,1989,1988,1987,1986,1985,1984,1983,1982,1981,1980,1979,1978,1977,1976,1975,1974,1973,1972,1971,1970,1969,1968,1967,1966,1965,1964,1963,1962,1961
Queste statistiche in altri paesi:
AfghanistanAlbaniaAlgeriaAngolaAntigua and BarbudaArab WorldArgentinaArmeniaArubaAustraliaAustriaAzerbaijanBahamas, TheBahrainBangladeshBarbadosBelarusBelgiumBelizeBeninBermudaBoliviaBosnia and HerzegovinaBrazilBrunei DarussalamBulgariaBurkina FasoBurundiCabo VerdeCambodiaCameroonCanadaCaribbean small statesCentral African RepublicCentral Europe and the BalticsChadChileChinaColombiaComorosCongo, Dem. Rep.Congo, Rep.Costa RicaCote d'IvoireCroatiaCubaCyprusCzech RepublicDenmarkDjiboutiDominicaDominican RepublicEarly-demographic dividendEast Asia & PacificEast Asia & Pacific (excluding high income)East Asia & Pacific (IDA & IBRD countries)EcuadorEgypt, Arab Rep.El SalvadorEquatorial GuineaEstoniaEthiopiaEuro areaEurope & Central AsiaEurope & Central Asia (excluding high income)Europe & Central Asia (IDA & IBRD countries)European UnionFaroe IslandsFijiFinlandFragile and conflict affected situationsFranceFrench PolynesiaGabonGambia, TheGeorgiaGermanyGhanaGibraltarGreeceGreenlandGrenadaGuamGuatemalaGuineaGuinea-BissauGuyanaHaitiHeavily indebted poor countries (HIPC)High incomeHondurasHong Kong SAR, ChinaHungaryIBRD onlyIcelandIDA & IBRD totalIDA blendIDA onlyIDA totalIndiaIndonesiaIran, Islamic Rep.IraqIrelandIsraelItalyJamaicaJapanJordanKazakhstanKenyaKiribatiKorea, Dem. People’s Rep.Korea, Rep.KosovoKuwaitKyrgyz RepublicLao PDRLate-demographic dividendLatin America & Caribbean Latin America & Caribbean (excluding high income)Latin America & the Caribbean (IDA & IBRD countries)LatviaLeast developed countries: UN classificationLebanonLiberiaLibyaLithuaniaLow & middle incomeLow incomeLower middle incomeLuxembourgMacao SAR, ChinaMacedonia, FYRMadagascarMalawiMalaysiaMaldivesMaliMaltaMauritaniaMauritiusMexicoMiddle East & North AfricaMiddle East & North Africa (excluding high income)Middle East & North Africa (IDA & IBRD countries)Middle incomeMoldovaMongoliaMontenegroMoroccoMozambiqueMyanmarNauruNepalNetherlandsNew CaledoniaNew ZealandNicaraguaNigerNigeriaNorth AmericaNorwayOECD membersOmanOther small statesPacific island small statesPakistanPanamaPapua New GuineaParaguayPeruPhilippinesPolandPortugalPost-demographic dividendPre-demographic dividendQatarRomaniaRussian FederationRwandaSamoaSao Tome and PrincipeSaudi ArabiaSenegalSerbiaSeychellesSierra LeoneSingaporeSlovak RepublicSloveniaSmall statesSolomon IslandsSomaliaSouth AfricaSouth AsiaSouth Asia (IDA & IBRD)SpainSri LankaSt. Kitts and NevisSt. LuciaSt. Vincent and the GrenadinesSub-Saharan Africa Sub-Saharan Africa (excluding high income)Sub-Saharan Africa (IDA & IBRD countries)SudanSurinameSwedenSwitzerlandSyrian Arab RepublicTajikistanTanzaniaThailandTogoTongaTrinidad and TobagoTunisiaTurkeyTurkmenistanTuvaluUgandaUkraineUnited Arab EmiratesUnited KingdomUnited StatesUpper middle incomeUruguayUzbekistanVanuatuVenezuela, RBVietnamWorldYemen, Rep.ZambiaZimbabwe Linea del tempo:
Questa scala temporale mostra un grafico dal 1961 anno al 2015 anno. Tunisia. I dati fino ad 1960 anno non disponibili. Il numero di osservazioni attuali secondo i date: 55.
La fonte (nome):
Indicatori dello sviluppo mondiale
La fonte (organizzazione):
World Bank staff estimates based data from International Monetary Fund's Direction of Trade database.
Categorie:
Private Sector, Trade
sono stati aggiornati
23 apr 2017 anni
Indicatori delle variazioni dei valori per anni
Minima:
69.49
1 gen 2014 anni
Massimo:
88.708
1 gen 1963 anni
Alla data di osservazione
Valore
Variazione assoluta
La variazione rispetto al valore precedente
1 gen 1961 anni
87.075
+87.075
0.0%
1 gen 1962 anni
87.37
+0.295
0.34%
1 gen 1963 anni
88.708
+1.338
1.53%
1 gen 1964 anni
85.295
-3.413
-3.85%
1 gen 1965 anni
79.398
-5.898
-6.91%
1 gen 1966 anni
81.227
+1.83
2.3%
1 gen 1967 anni
76.831
-4.396
-5.41%
1 gen 1968 anni
80.451
+3.621
4.71%
1 gen 1969 anni
85.399
+4.948
6.15%
1 gen 1970 anni
83.186
-2.213
-2.59%
1 gen 1971 anni
84.294
+1.108
1.33%
1 gen 1972 anni
83.745
-0.549
-0.65%
1 gen 1973 anni
84.135
+0.391
0.47%
1 gen 1974 anni
83.023
-1.113
-1.32%
1 gen 1975 anni
79.457
-3.565
-4.29%
1 gen 1976 anni
82.843
+3.385
4.26%
1 gen 1977 anni
83.207
+0.364
0.44%
1 gen 1978 anni
86.724
+3.517
4.23%
1 gen 1979 anni
84.457
-2.267
-2.61%
1 gen 1980 anni
83.046
-1.411
-1.67%
1 gen 1981 anni
87.976
+4.929
5.94%
1 gen 1982 anni
88.448
+0.472
0.54%
1 gen 1983 anni
87.292
-1.156
-1.31%
1 gen 1984 anni
83.946
-3.346
-3.83%
1 gen 1985 anni
81.17
-2.776
-3.31%
1 gen 1986 anni
80.815
-0.355
-0.44%
1 gen 1987 anni
82.648
+1.833
2.27%
1 gen 1988 anni
83.433
+0.785
0.95%
1 gen 1989 anni
79.882
-3.551
-4.26%
1 gen 1990 anni
73.886
-5.996
-7.51%
1 gen 1991 anni
74.029
+0.143
0.19%
1 gen 1992 anni
78.07
+4.042
5.46%
1 gen 1993 anni
82.925
+4.855
6.22%
1 gen 1994 anni
85.001
+2.076
2.5%
1 gen 1995 anni
82.216
-2.785
-3.28%
1 gen 1996 anni
78.437
-3.778
-4.6%
1 gen 1997 anni
81.913
+3.476
4.43%
1 gen 1998 anni
82.329
+0.416
0.51%
1 gen 1999 anni
87.616
+5.287
6.42%
1 gen 2000 anni
87.784
+0.168
0.19%
1 gen 2001 anni
85.184
-2.6
-2.96%
1 gen 2002 anni
84.699
-0.485
-0.57%
1 gen 2003 anni
84.316
-0.383
-0.45%
1 gen 2004 anni
84.556
+0.24
0.29%
1 gen 2005 anni
81.727
-2.828
-3.35%
1 gen 2006 anni
80.379
-1.349
-1.65%
1 gen 2007 anni
78.988
-1.39
-1.73%
1 gen 2008 anni
79.063
+0.074
0.09%
1 gen 2009 anni
74.876
-4.187
-5.3%
1 gen 2010 anni
76.302
+1.426
1.9%
1 gen 2011 anni
78.177
+1.875
2.46%
1 gen 2012 anni
76.222
-1.954
-2.5%
1 gen 2013 anni
71.154
-5.069
-6.65%
1 gen 2014 anni
69.49
-1.664
-2.34%
1 gen 2015 anni
75.957
+6.467
9.31%
Classificazione dei paesi secondo i statistiche attuali per anni


Commenti: