29
/es/
es
AIzaSyAYiBZKx7MnpbEhh9jyipgxe19OcubqV5w
April 1, 2024
54996
Post-demographic dividend
PST
false
2
1
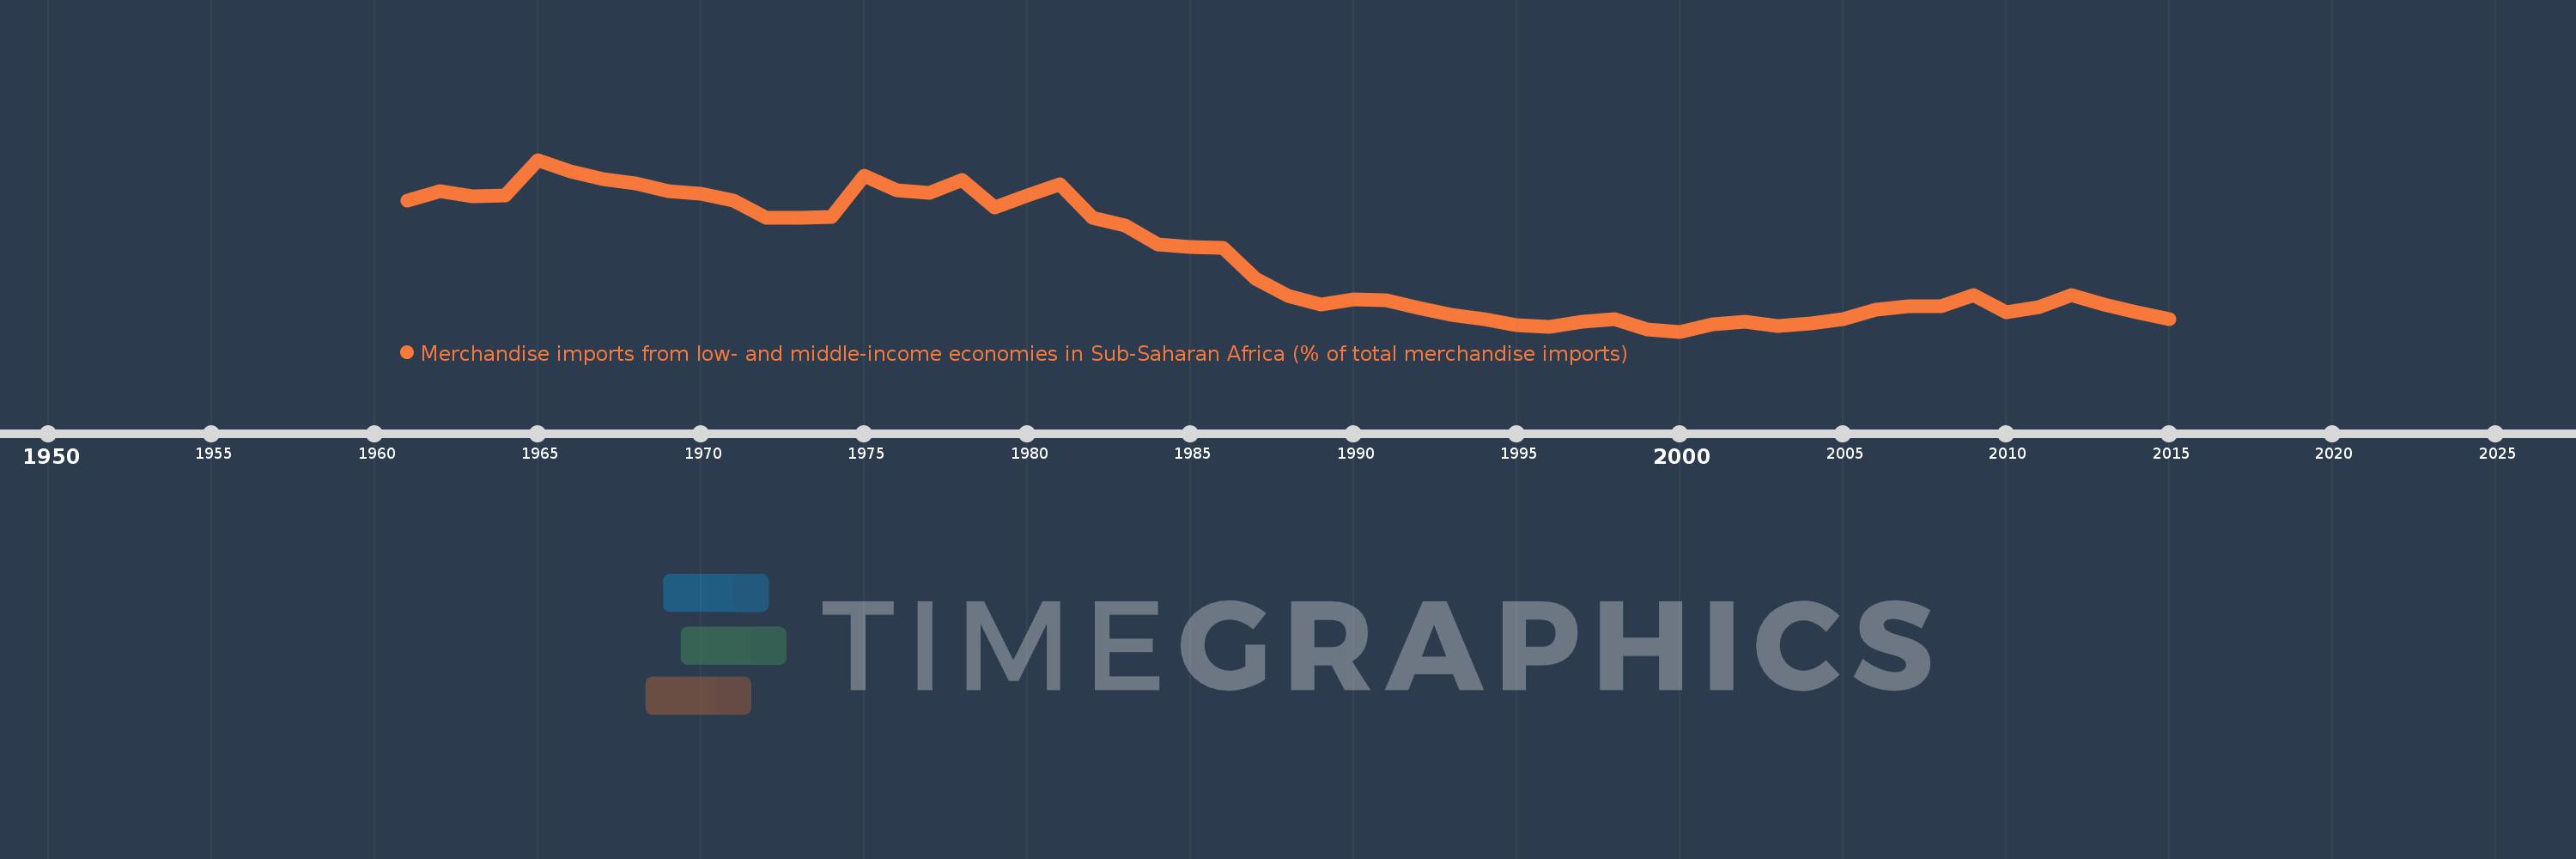
Merchandise imports from low- and middle-income economies in Sub-Saharan Africa (% of total merchandise imports)
2015,2014,2013,2012,2011,2010,2009,2008,2007,2006,2005,2004,2003,2002,2001,2000,1999,1998,1997,1996,1995,1994,1993,1992,1991,1990,1989,1988,1987,1986,1985,1984,1983,1982,1981,1980,1979,1978,1977,1976,1975,1974,1973,1972,1971,1970,1969,1968,1967,1966,1965,1964,1963,1962,1961
Estas estadísticas en otros países:
AlbaniaAlgeriaAngolaArab WorldArgentinaArmeniaArubaAustraliaAustriaAzerbaijanBahamas, TheBahrainBangladeshBarbadosBelarusBelgiumBelizeBeninBermudaBoliviaBrazilBrunei DarussalamBulgariaBurkina FasoBurundiCabo VerdeCambodiaCameroonCanadaCaribbean small statesCentral African RepublicCentral Europe and the BalticsChadChileChinaColombiaCongo, Dem. Rep.Congo, Rep.Costa RicaCote d'IvoireCroatiaCubaCyprusCzech RepublicDenmarkDjiboutiDominicaDominican RepublicEarly-demographic dividendEast Asia & PacificEast Asia & Pacific (excluding high income)East Asia & Pacific (IDA & IBRD countries)EcuadorEgypt, Arab Rep.El SalvadorEstoniaEthiopiaEuro areaEurope & Central AsiaEurope & Central Asia (excluding high income)Europe & Central Asia (IDA & IBRD countries)European UnionFijiFinlandFragile and conflict affected situationsFranceGabonGambia, TheGeorgiaGermanyGhanaGreeceGreenlandGrenadaGuatemalaGuineaGuinea-BissauGuyanaHaitiHeavily indebted poor countries (HIPC)High incomeHondurasHong Kong SAR, ChinaHungaryIBRD onlyIcelandIDA & IBRD totalIDA blendIDA onlyIDA totalIndiaIndonesiaIran, Islamic Rep.IraqIrelandIsraelItalyJamaicaJapanJordanKazakhstanKenyaKorea, Dem. People’s Rep.Korea, Rep.KuwaitLao PDRLate-demographic dividendLatin America & Caribbean Latin America & Caribbean (excluding high income)Latin America & the Caribbean (IDA & IBRD countries)LatviaLeast developed countries: UN classificationLebanonLiberiaLibyaLithuaniaLow & middle incomeLow incomeLower middle incomeLuxembourgMacao SAR, ChinaMacedonia, FYRMadagascarMalawiMalaysiaMaliMaltaMauritaniaMauritiusMexicoMiddle East & North AfricaMiddle East & North Africa (excluding high income)Middle East & North Africa (IDA & IBRD countries)Middle incomeMoldovaMontenegroMoroccoMozambiqueMyanmarNetherlandsNew CaledoniaNew ZealandNicaraguaNigerNigeriaNorth AmericaNorwayOECD membersOmanOther small statesPacific island small statesPakistanPanamaPapua New GuineaParaguayPeruPhilippinesPolandPortugalPost-demographic dividendPre-demographic dividendQatarRomaniaRussian FederationRwandaSaudi ArabiaSenegalSerbiaSeychellesSierra LeoneSingaporeSlovak RepublicSloveniaSmall statesSomaliaSouth AfricaSouth AsiaSouth Asia (IDA & IBRD)SpainSri LankaSt. LuciaSt. Vincent and the GrenadinesSub-Saharan Africa Sub-Saharan Africa (excluding high income)Sub-Saharan Africa (IDA & IBRD countries)SudanSurinameSwedenSwitzerlandSyrian Arab RepublicTanzaniaThailandTogoTrinidad and TobagoTunisiaTurkeyUgandaUkraineUnited Arab EmiratesUnited KingdomUnited StatesUpper middle incomeUruguayVenezuela, RBVietnamWorldYemen, Rep.ZambiaZimbabwe línea de tiempo (timeline):
En esta escala de tiempo se presenta un gráfico de 1961 y 2015 de Post-demographic dividend. Los datos de 1960 están ausentes. El número de observaciones reales por fecha: 55.
Fuente (nombre):
Indicadores del desarrollo mundial
Fuente (organización):
World Bank staff estimates based data from International Monetary Fund's Direction of Trade database.
Categorías:
Private Sector, Trade
Se ha actualizado:
23 abr 2017 año
Los indicadores de los cambios de valor en los últimos años
Mínimo:
1.262
1 ene 2000 año
Máximo:
4.548
1 ene 1965 año
A la fecha de observación
Valor
Cambio absoluto
El cambio con respecto al valor anterior
1 ene 1961 año
3.773
+3.773
0.0%
1 ene 1962 año
3.95
+0.177
4.68%
1 ene 1963 año
3.853
-0.097
-2.45%
1 ene 1964 año
3.869
+0.016
0.43%
1 ene 1965 año
4.548
+0.679
17.55%
1 ene 1966 año
4.319
-0.23
-5.06%
1 ene 1967 año
4.186
-0.133
-3.07%
1 ene 1968 año
4.093
-0.092
-2.21%
1 ene 1969 año
3.949
-0.145
-3.54%
1 ene 1970 año
3.903
-0.045
-1.15%
1 ene 1971 año
3.764
-0.14
-3.58%
1 ene 1972 año
3.438
-0.326
-8.65%
1 ene 1973 año
3.44
+0.002
0.05%
1 ene 1974 año
3.454
+0.014
0.4%
1 ene 1975 año
4.241
+0.787
22.78%
1 ene 1976 año
3.958
-0.282
-6.66%
1 ene 1977 año
3.911
-0.047
-1.19%
1 ene 1978 año
4.161
+0.25
6.38%
1 ene 1979 año
3.64
-0.521
-12.51%
1 ene 1980 año
3.872
+0.232
6.37%
1 ene 1981 año
4.08
+0.208
5.37%
1 ene 1982 año
3.435
-0.646
-15.82%
1 ene 1983 año
3.285
-0.149
-4.35%
1 ene 1984 año
2.936
-0.35
-10.64%
1 ene 1985 año
2.881
-0.055
-1.87%
1 ene 1986 año
2.866
-0.015
-0.51%
1 ene 1987 año
2.279
-0.587
-20.48%
1 ene 1988 año
1.95
-0.329
-14.44%
1 ene 1989 año
1.78
-0.17
-8.71%
1 ene 1990 año
1.878
+0.098
5.51%
1 ene 1991 año
1.857
-0.021
-1.14%
1 ene 1992 año
1.711
-0.145
-7.83%
1 ene 1993 año
1.584
-0.128
-7.47%
1 ene 1994 año
1.493
-0.091
-5.74%
1 ene 1995 año
1.393
-0.099
-6.66%
1 ene 1996 año
1.348
-0.046
-3.27%
1 ene 1997 año
1.45
+0.103
7.61%
1 ene 1998 año
1.495
+0.044
3.06%
1 ene 1999 año
1.309
-0.185
-12.41%
1 ene 2000 año
1.262
-0.047
-3.63%
1 ene 2001 año
1.405
+0.144
11.38%
1 ene 2002 año
1.45
+0.045
3.18%
1 ene 2003 año
1.364
-0.086
-5.94%
1 ene 2004 año
1.424
+0.06
4.41%
1 ene 2005 año
1.494
+0.071
4.96%
1 ene 2006 año
1.685
+0.19
12.75%
1 ene 2007 año
1.743
+0.059
3.48%
1 ene 2008 año
1.749
+0.006
0.34%
1 ene 2009 año
1.966
+0.217
12.41%
1 ene 2010 año
1.628
-0.338
-17.2%
1 ene 2011 año
1.736
+0.108
6.62%
1 ene 2012 año
1.957
+0.221
12.72%
1 ene 2013 año
1.785
-0.172
-8.8%
1 ene 2014 año
1.631
-0.153
-8.6%
1 ene 2015 año
1.508
-0.123
-7.53%
Ranking de los países por los datos estadísticos actuales


Comentarios: