29
/es/
es
AIzaSyAYiBZKx7MnpbEhh9jyipgxe19OcubqV5w
April 1, 2024
160747
Israel
ISR
true
2
1
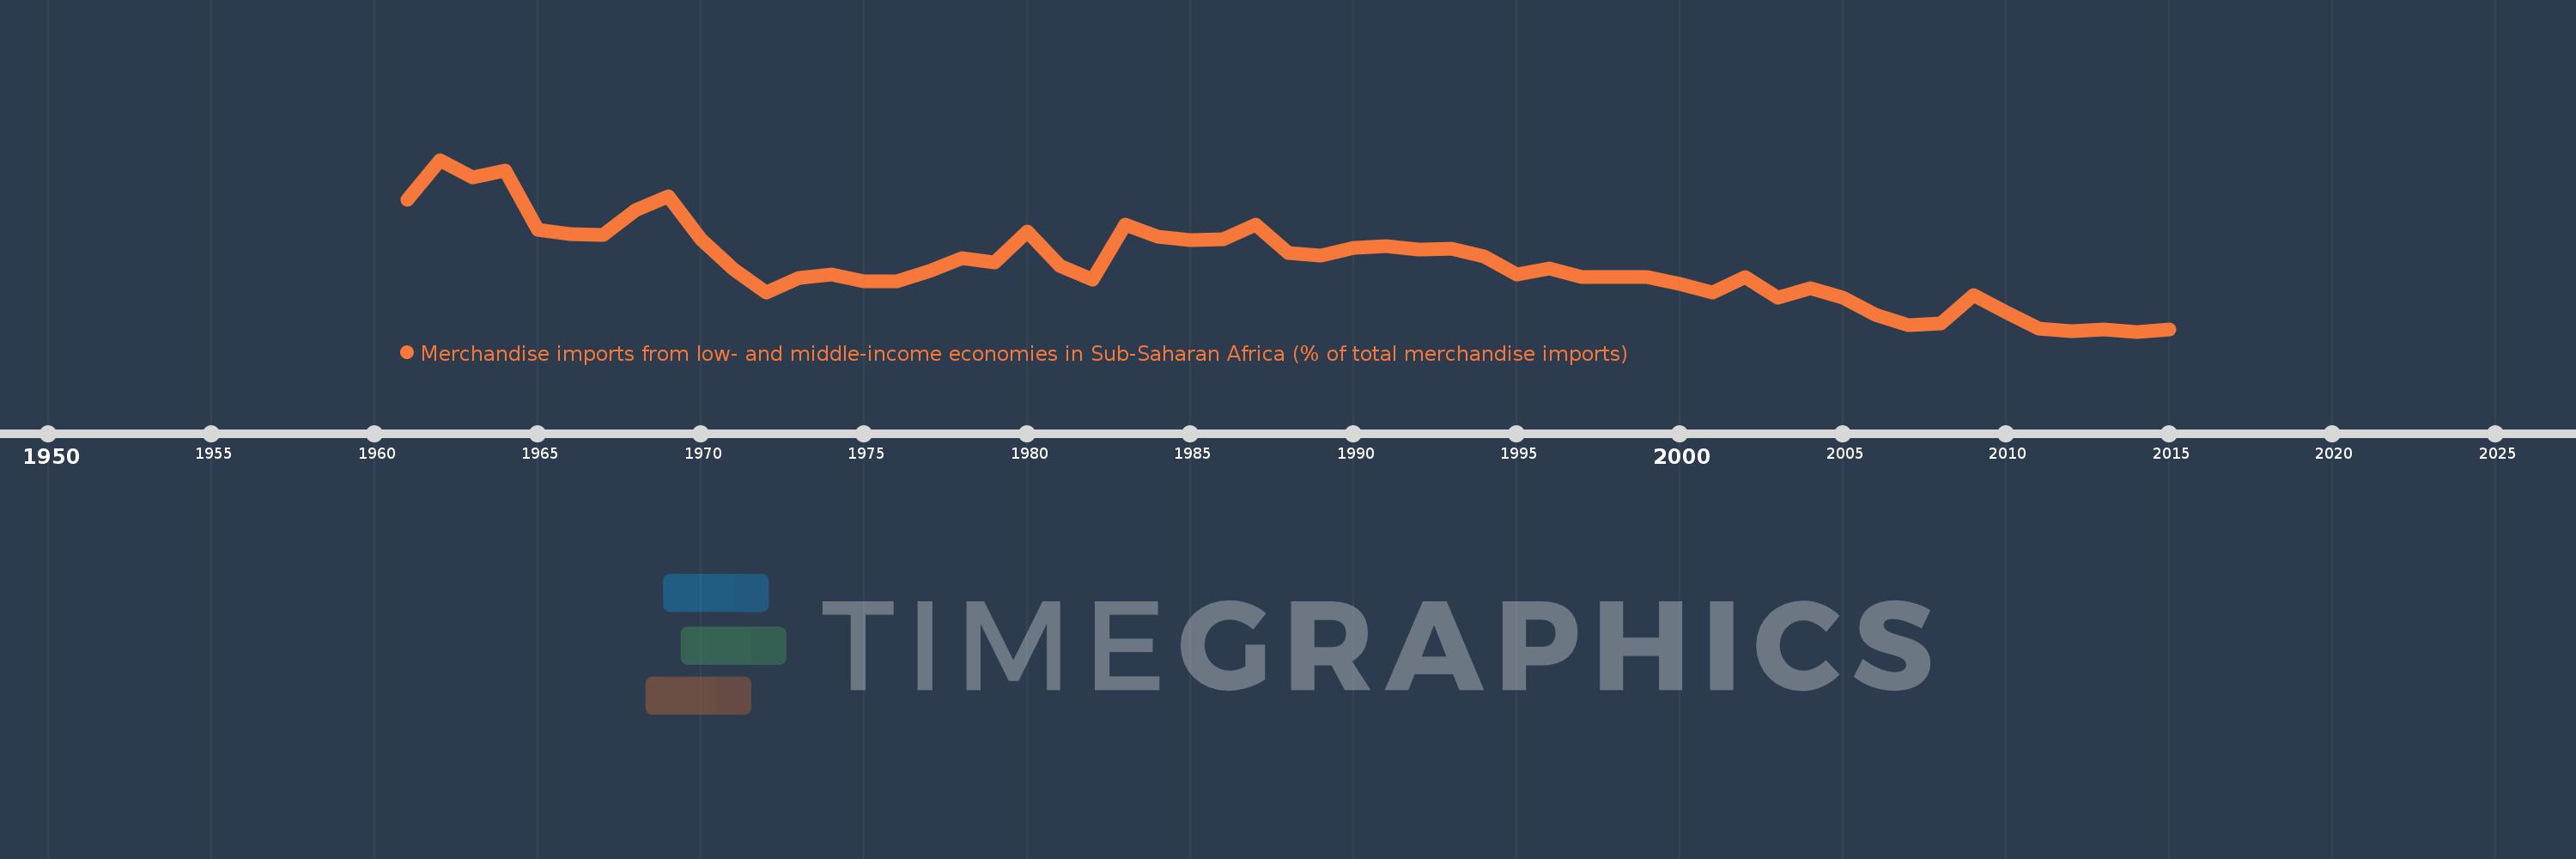
Merchandise imports from low- and middle-income economies in Sub-Saharan Africa (% of total merchandise imports)
2015,2014,2013,2012,2011,2010,2009,2008,2007,2006,2005,2004,2003,2002,2001,2000,1999,1998,1997,1996,1995,1994,1993,1992,1991,1990,1989,1988,1987,1986,1985,1984,1983,1982,1981,1980,1979,1978,1977,1976,1975,1974,1973,1972,1971,1970,1969,1968,1967,1966,1965,1964,1963,1962,1961
Estas estadísticas en otros países:
AlbaniaAlgeriaAngolaArab WorldArgentinaArmeniaArubaAustraliaAustriaAzerbaijanBahamas, TheBahrainBangladeshBarbadosBelarusBelgiumBelizeBeninBermudaBoliviaBrazilBrunei DarussalamBulgariaBurkina FasoBurundiCabo VerdeCambodiaCameroonCanadaCaribbean small statesCentral African RepublicCentral Europe and the BalticsChadChileChinaColombiaCongo, Dem. Rep.Congo, Rep.Costa RicaCote d'IvoireCroatiaCubaCyprusCzech RepublicDenmarkDjiboutiDominicaDominican RepublicEarly-demographic dividendEast Asia & PacificEast Asia & Pacific (excluding high income)East Asia & Pacific (IDA & IBRD countries)EcuadorEgypt, Arab Rep.El SalvadorEstoniaEthiopiaEuro areaEurope & Central AsiaEurope & Central Asia (excluding high income)Europe & Central Asia (IDA & IBRD countries)European UnionFijiFinlandFragile and conflict affected situationsFranceGabonGambia, TheGeorgiaGermanyGhanaGreeceGreenlandGrenadaGuatemalaGuineaGuinea-BissauGuyanaHaitiHeavily indebted poor countries (HIPC)High incomeHondurasHong Kong SAR, ChinaHungaryIBRD onlyIcelandIDA & IBRD totalIDA blendIDA onlyIDA totalIndiaIndonesiaIran, Islamic Rep.IraqIrelandIsraelItalyJamaicaJapanJordanKazakhstanKenyaKorea, Dem. People’s Rep.Korea, Rep.KuwaitLao PDRLate-demographic dividendLatin America & Caribbean Latin America & Caribbean (excluding high income)Latin America & the Caribbean (IDA & IBRD countries)LatviaLeast developed countries: UN classificationLebanonLiberiaLibyaLithuaniaLow & middle incomeLow incomeLower middle incomeLuxembourgMacao SAR, ChinaMacedonia, FYRMadagascarMalawiMalaysiaMaliMaltaMauritaniaMauritiusMexicoMiddle East & North AfricaMiddle East & North Africa (excluding high income)Middle East & North Africa (IDA & IBRD countries)Middle incomeMoldovaMontenegroMoroccoMozambiqueMyanmarNetherlandsNew CaledoniaNew ZealandNicaraguaNigerNigeriaNorth AmericaNorwayOECD membersOmanOther small statesPacific island small statesPakistanPanamaPapua New GuineaParaguayPeruPhilippinesPolandPortugalPost-demographic dividendPre-demographic dividendQatarRomaniaRussian FederationRwandaSaudi ArabiaSenegalSerbiaSeychellesSierra LeoneSingaporeSlovak RepublicSloveniaSmall statesSomaliaSouth AfricaSouth AsiaSouth Asia (IDA & IBRD)SpainSri LankaSt. LuciaSt. Vincent and the GrenadinesSub-Saharan Africa Sub-Saharan Africa (excluding high income)Sub-Saharan Africa (IDA & IBRD countries)SudanSurinameSwedenSwitzerlandSyrian Arab RepublicTanzaniaThailandTogoTrinidad and TobagoTunisiaTurkeyUgandaUkraineUnited Arab EmiratesUnited KingdomUnited StatesUpper middle incomeUruguayVenezuela, RBVietnamWorldYemen, Rep.ZambiaZimbabwe línea de tiempo (timeline):
En esta escala de tiempo se presenta un gráfico de 1961 y 2015 de Israel. Los datos de 1960 están ausentes. El número de observaciones reales por fecha: 55.
Fuente (nombre):
Indicadores del desarrollo mundial
Fuente (organización):
World Bank staff estimates based data from International Monetary Fund's Direction of Trade database.
Categorías:
Private Sector, Trade
Se ha actualizado:
23 abr 2017 año
Los indicadores de los cambios de valor en los últimos años
Mínimo:
0.264
1 ene 2014 año
Máximo:
3.25
1 ene 1962 año
A la fecha de observación
Valor
Cambio absoluto
El cambio con respecto al valor anterior
1 ene 1961 año
2.56
+2.56
0.0%
1 ene 1962 año
3.25
+0.69
26.96%
1 ene 1963 año
2.945
-0.305
-9.38%
1 ene 1964 año
3.057
+0.111
3.79%
1 ene 1965 año
2.04
-1.017
-33.25%
1 ene 1966 año
1.956
-0.084
-4.13%
1 ene 1967 año
1.944
-0.012
-0.63%
1 ene 1968 año
2.372
+0.428
22.04%
1 ene 1969 año
2.613
+0.241
10.16%
1 ene 1970 año
1.869
-0.744
-28.47%
1 ene 1971 año
1.346
-0.524
-28.01%
1 ene 1972 año
0.938
-0.407
-30.26%
1 ene 1973 año
1.191
+0.253
26.92%
1 ene 1974 año
1.256
+0.065
5.5%
1 ene 1975 año
1.142
-0.114
-9.1%
1 ene 1976 año
1.133
-0.01
-0.84%
1 ene 1977 año
1.322
+0.19
16.76%
1 ene 1978 año
1.534
+0.212
16.03%
1 ene 1979 año
1.47
-0.064
-4.2%
1 ene 1980 año
1.997
+0.527
35.82%
1 ene 1981 año
1.401
-0.596
-29.83%
1 ene 1982 año
1.17
-0.231
-16.52%
1 ene 1983 año
2.116
+0.947
80.93%
1 ene 1984 año
1.914
-0.202
-9.55%
1 ene 1985 año
1.86
-0.054
-2.82%
1 ene 1986 año
1.872
+0.012
0.64%
1 ene 1987 año
2.119
+0.247
13.21%
1 ene 1988 año
1.625
-0.494
-23.31%
1 ene 1989 año
1.59
-0.035
-2.17%
1 ene 1990 año
1.713
+0.123
7.74%
1 ene 1991 año
1.747
+0.034
1.96%
1 ene 1992 año
1.683
-0.063
-3.63%
1 ene 1993 año
1.708
+0.025
1.48%
1 ene 1994 año
1.571
-0.137
-8.03%
1 ene 1995 año
1.257
-0.314
-19.98%
1 ene 1996 año
1.356
+0.099
7.86%
1 ene 1997 año
1.206
-0.15
-11.07%
1 ene 1998 año
1.21
+0.005
0.38%
1 ene 1999 año
1.215
+0.004
0.35%
1 ene 2000 año
1.089
-0.126
-10.36%
1 ene 2001 año
0.944
-0.145
-13.34%
1 ene 2002 año
1.21
+0.267
28.25%
1 ene 2003 año
0.86
-0.351
-28.97%
1 ene 2004 año
1.013
+0.153
17.84%
1 ene 2005 año
0.857
-0.156
-15.36%
1 ene 2006 año
0.55
-0.307
-35.8%
1 ene 2007 año
0.377
-0.173
-31.48%
1 ene 2008 año
0.403
+0.026
6.94%
1 ene 2009 año
0.903
+0.499
123.8%
1 ene 2010 año
0.593
-0.31
-34.33%
1 ene 2011 año
0.318
-0.274
-46.29%
1 ene 2012 año
0.27
-0.048
-15.23%
1 ene 2013 año
0.303
+0.033
12.22%
1 ene 2014 año
0.264
-0.039
-12.95%
1 ene 2015 año
0.296
+0.032
12.12%
Ranking de los países por los datos estadísticos actuales


Comentarios: