29
/es/
es
AIzaSyAYiBZKx7MnpbEhh9jyipgxe19OcubqV5w
April 1, 2024
40908
Late-demographic dividend
LTE
false
2
1
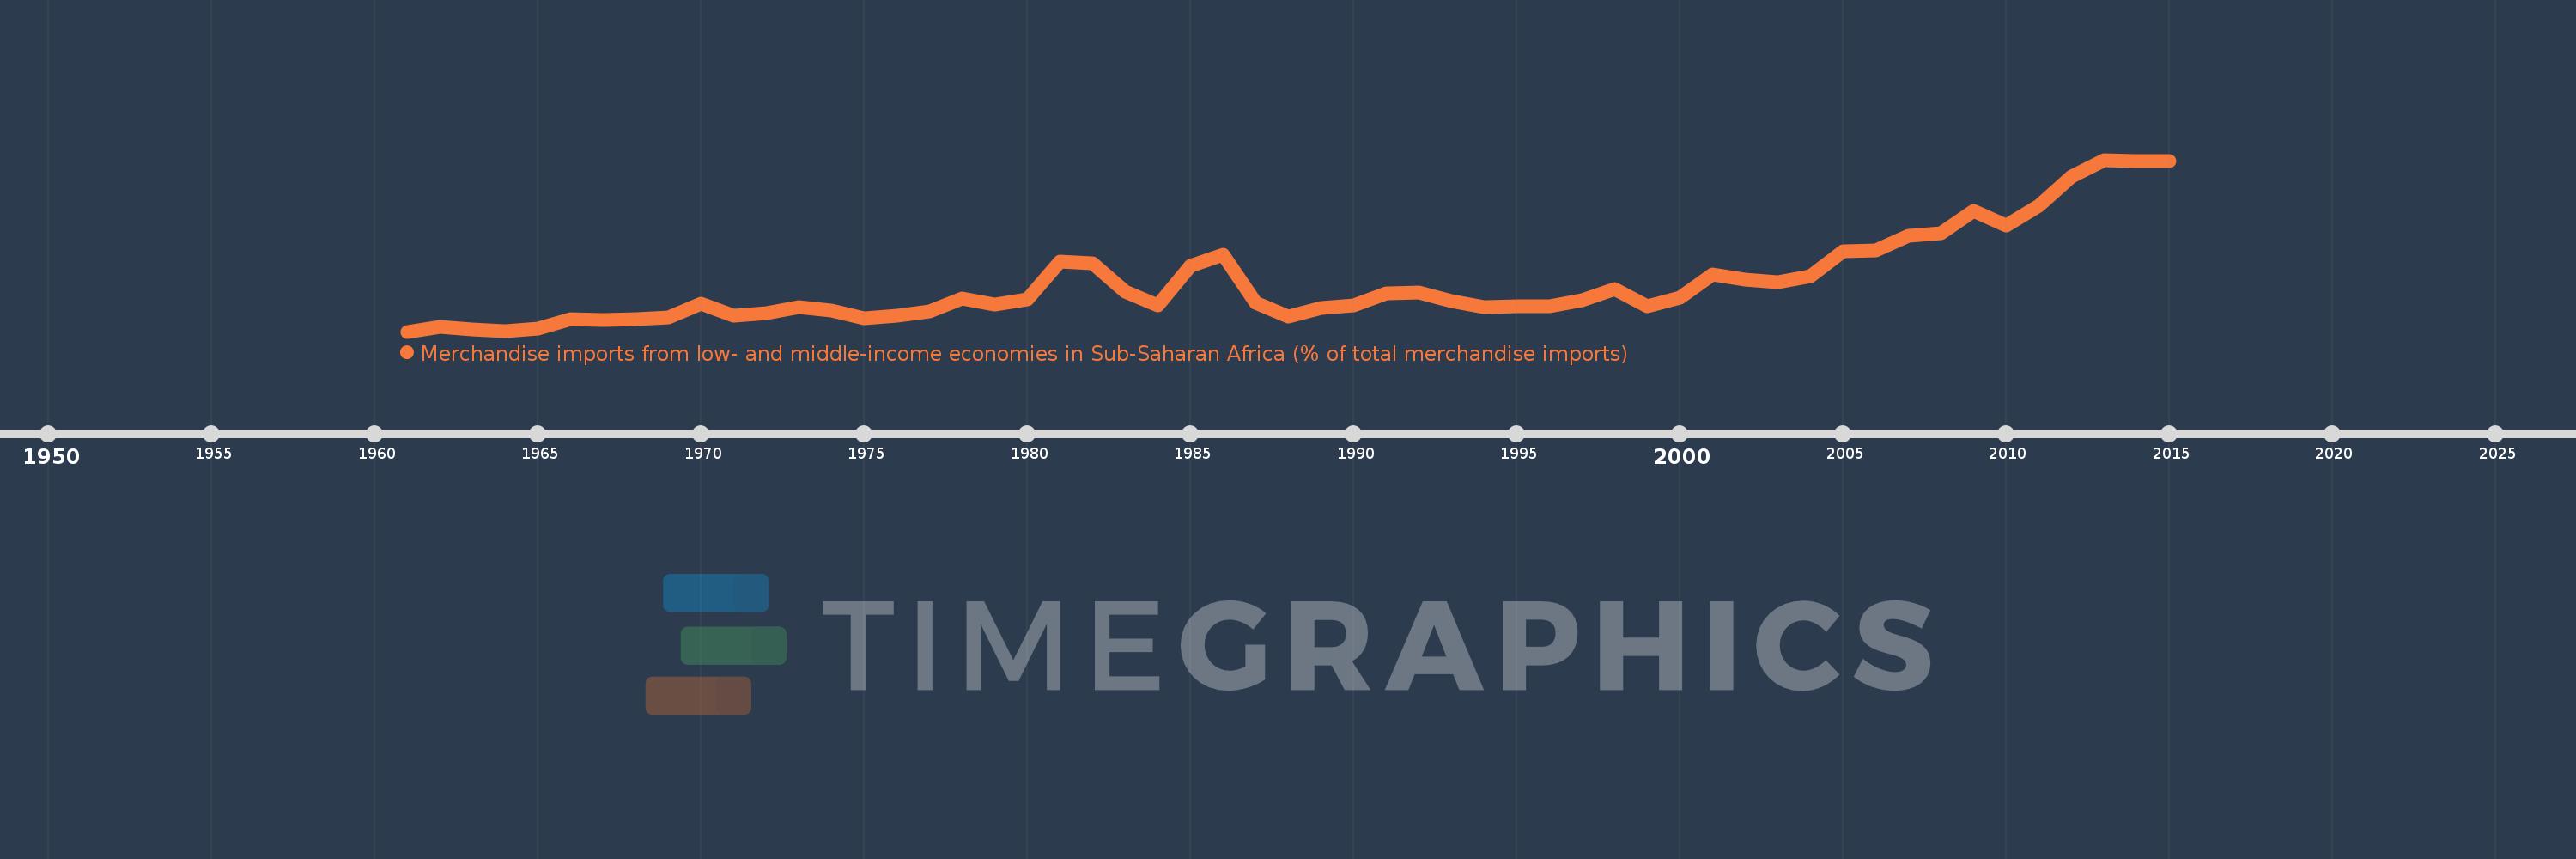
Merchandise imports from low- and middle-income economies in Sub-Saharan Africa (% of total merchandise imports)
2015,2014,2013,2012,2011,2010,2009,2008,2007,2006,2005,2004,2003,2002,2001,2000,1999,1998,1997,1996,1995,1994,1993,1992,1991,1990,1989,1988,1987,1986,1985,1984,1983,1982,1981,1980,1979,1978,1977,1976,1975,1974,1973,1972,1971,1970,1969,1968,1967,1966,1965,1964,1963,1962,1961
Estas estadísticas en otros países:
AlbaniaAlgeriaAngolaArab WorldArgentinaArmeniaArubaAustraliaAustriaAzerbaijanBahamas, TheBahrainBangladeshBarbadosBelarusBelgiumBelizeBeninBermudaBoliviaBrazilBrunei DarussalamBulgariaBurkina FasoBurundiCabo VerdeCambodiaCameroonCanadaCaribbean small statesCentral African RepublicCentral Europe and the BalticsChadChileChinaColombiaCongo, Dem. Rep.Congo, Rep.Costa RicaCote d'IvoireCroatiaCubaCyprusCzech RepublicDenmarkDjiboutiDominicaDominican RepublicEarly-demographic dividendEast Asia & PacificEast Asia & Pacific (excluding high income)East Asia & Pacific (IDA & IBRD countries)EcuadorEgypt, Arab Rep.El SalvadorEstoniaEthiopiaEuro areaEurope & Central AsiaEurope & Central Asia (excluding high income)Europe & Central Asia (IDA & IBRD countries)European UnionFijiFinlandFragile and conflict affected situationsFranceGabonGambia, TheGeorgiaGermanyGhanaGreeceGreenlandGrenadaGuatemalaGuineaGuinea-BissauGuyanaHaitiHeavily indebted poor countries (HIPC)High incomeHondurasHong Kong SAR, ChinaHungaryIBRD onlyIcelandIDA & IBRD totalIDA blendIDA onlyIDA totalIndiaIndonesiaIran, Islamic Rep.IraqIrelandIsraelItalyJamaicaJapanJordanKazakhstanKenyaKorea, Dem. People’s Rep.Korea, Rep.KuwaitLao PDRLate-demographic dividendLatin America & Caribbean Latin America & Caribbean (excluding high income)Latin America & the Caribbean (IDA & IBRD countries)LatviaLeast developed countries: UN classificationLebanonLiberiaLibyaLithuaniaLow & middle incomeLow incomeLower middle incomeLuxembourgMacao SAR, ChinaMacedonia, FYRMadagascarMalawiMalaysiaMaliMaltaMauritaniaMauritiusMexicoMiddle East & North AfricaMiddle East & North Africa (excluding high income)Middle East & North Africa (IDA & IBRD countries)Middle incomeMoldovaMontenegroMoroccoMozambiqueMyanmarNetherlandsNew CaledoniaNew ZealandNicaraguaNigerNigeriaNorth AmericaNorwayOECD membersOmanOther small statesPacific island small statesPakistanPanamaPapua New GuineaParaguayPeruPhilippinesPolandPortugalPost-demographic dividendPre-demographic dividendQatarRomaniaRussian FederationRwandaSaudi ArabiaSenegalSerbiaSeychellesSierra LeoneSingaporeSlovak RepublicSloveniaSmall statesSomaliaSouth AfricaSouth AsiaSouth Asia (IDA & IBRD)SpainSri LankaSt. LuciaSt. Vincent and the GrenadinesSub-Saharan Africa Sub-Saharan Africa (excluding high income)Sub-Saharan Africa (IDA & IBRD countries)SudanSurinameSwedenSwitzerlandSyrian Arab RepublicTanzaniaThailandTogoTrinidad and TobagoTunisiaTurkeyUgandaUkraineUnited Arab EmiratesUnited KingdomUnited StatesUpper middle incomeUruguayVenezuela, RBVietnamWorldYemen, Rep.ZambiaZimbabwe línea de tiempo (timeline):
En esta escala de tiempo se presenta un gráfico de 1961 y 2015 de Late-demographic dividend. Los datos de 1960 están ausentes. El número de observaciones reales por fecha: 55.
Fuente (nombre):
Indicadores del desarrollo mundial
Fuente (organización):
World Bank staff estimates based data from International Monetary Fund's Direction of Trade database.
Categorías:
Private Sector, Trade
Se ha actualizado:
23 abr 2017 año
Los indicadores de los cambios de valor en los últimos años
Mínimo:
0.485
1 ene 1961 año
Máximo:
3.117
1 ene 2013 año
A la fecha de observación
Valor
Cambio absoluto
El cambio con respecto al valor anterior
1 ene 1961 año
0.485
+0.485
0.0%
1 ene 1962 año
0.562
+0.077
15.92%
1 ene 1963 año
0.518
-0.044
-7.82%
1 ene 1964 año
0.498
-0.02
-3.93%
1 ene 1965 año
0.525
+0.027
5.4%
1 ene 1966 año
0.676
+0.151
28.74%
1 ene 1967 año
0.662
-0.014
-2.05%
1 ene 1968 año
0.673
+0.011
1.7%
1 ene 1969 año
0.703
+0.03
4.39%
1 ene 1970 año
0.909
+0.206
29.34%
1 ene 1971 año
0.726
-0.183
-20.12%
1 ene 1972 año
0.767
+0.041
5.66%
1 ene 1973 año
0.856
+0.089
11.61%
1 ene 1974 año
0.803
-0.053
-6.21%
1 ene 1975 año
0.691
-0.112
-13.93%
1 ene 1976 año
0.733
+0.042
6.14%
1 ene 1977 año
0.8
+0.067
9.09%
1 ene 1978 año
0.987
+0.187
23.37%
1 ene 1979 año
0.894
-0.093
-9.38%
1 ene 1980 año
0.978
+0.084
9.34%
1 ene 1981 año
1.564
+0.586
59.94%
1 ene 1982 año
1.53
-0.034
-2.2%
1 ene 1983 año
1.1
-0.43
-28.11%
1 ene 1984 año
0.881
-0.219
-19.88%
1 ene 1985 año
1.488
+0.607
68.89%
1 ene 1986 año
1.661
+0.173
11.65%
1 ene 1987 año
0.929
-0.732
-44.07%
1 ene 1988 año
0.716
-0.213
-22.9%
1 ene 1989 año
0.844
+0.127
17.77%
1 ene 1990 año
0.887
+0.043
5.14%
1 ene 1991 año
1.074
+0.187
21.1%
1 ene 1992 año
1.086
+0.011
1.07%
1 ene 1993 año
0.948
-0.138
-12.73%
1 ene 1994 año
0.865
-0.083
-8.72%
1 ene 1995 año
0.873
+0.008
0.98%
1 ene 1996 año
0.877
+0.003
0.4%
1 ene 1997 año
0.97
+0.093
10.64%
1 ene 1998 año
1.138
+0.168
17.32%
1 ene 1999 año
0.872
-0.267
-23.42%
1 ene 2000 año
1.01
+0.138
15.84%
1 ene 2001 año
1.354
+0.344
34.09%
1 ene 2002 año
1.281
-0.073
-5.38%
1 ene 2003 año
1.24
-0.041
-3.21%
1 ene 2004 año
1.333
+0.093
7.48%
1 ene 2005 año
1.72
+0.387
29.04%
1 ene 2006 año
1.724
+0.004
0.21%
1 ene 2007 año
1.956
+0.232
13.45%
1 ene 2008 año
1.993
+0.037
1.89%
1 ene 2009 año
2.336
+0.344
17.24%
1 ene 2010 año
2.105
-0.231
-9.88%
1 ene 2011 año
2.417
+0.312
14.82%
1 ene 2012 año
2.858
+0.44
18.21%
1 ene 2013 año
3.117
+0.259
9.08%
1 ene 2014 año
3.099
-0.018
-0.58%
1 ene 2015 año
3.095
-0.004
-0.13%
Ranking de los países por los datos estadísticos actuales


Comentarios: