29
/es/
es
AIzaSyAYiBZKx7MnpbEhh9jyipgxe19OcubqV5w
April 1, 2024
190519
Mali
MLI
true
2
1
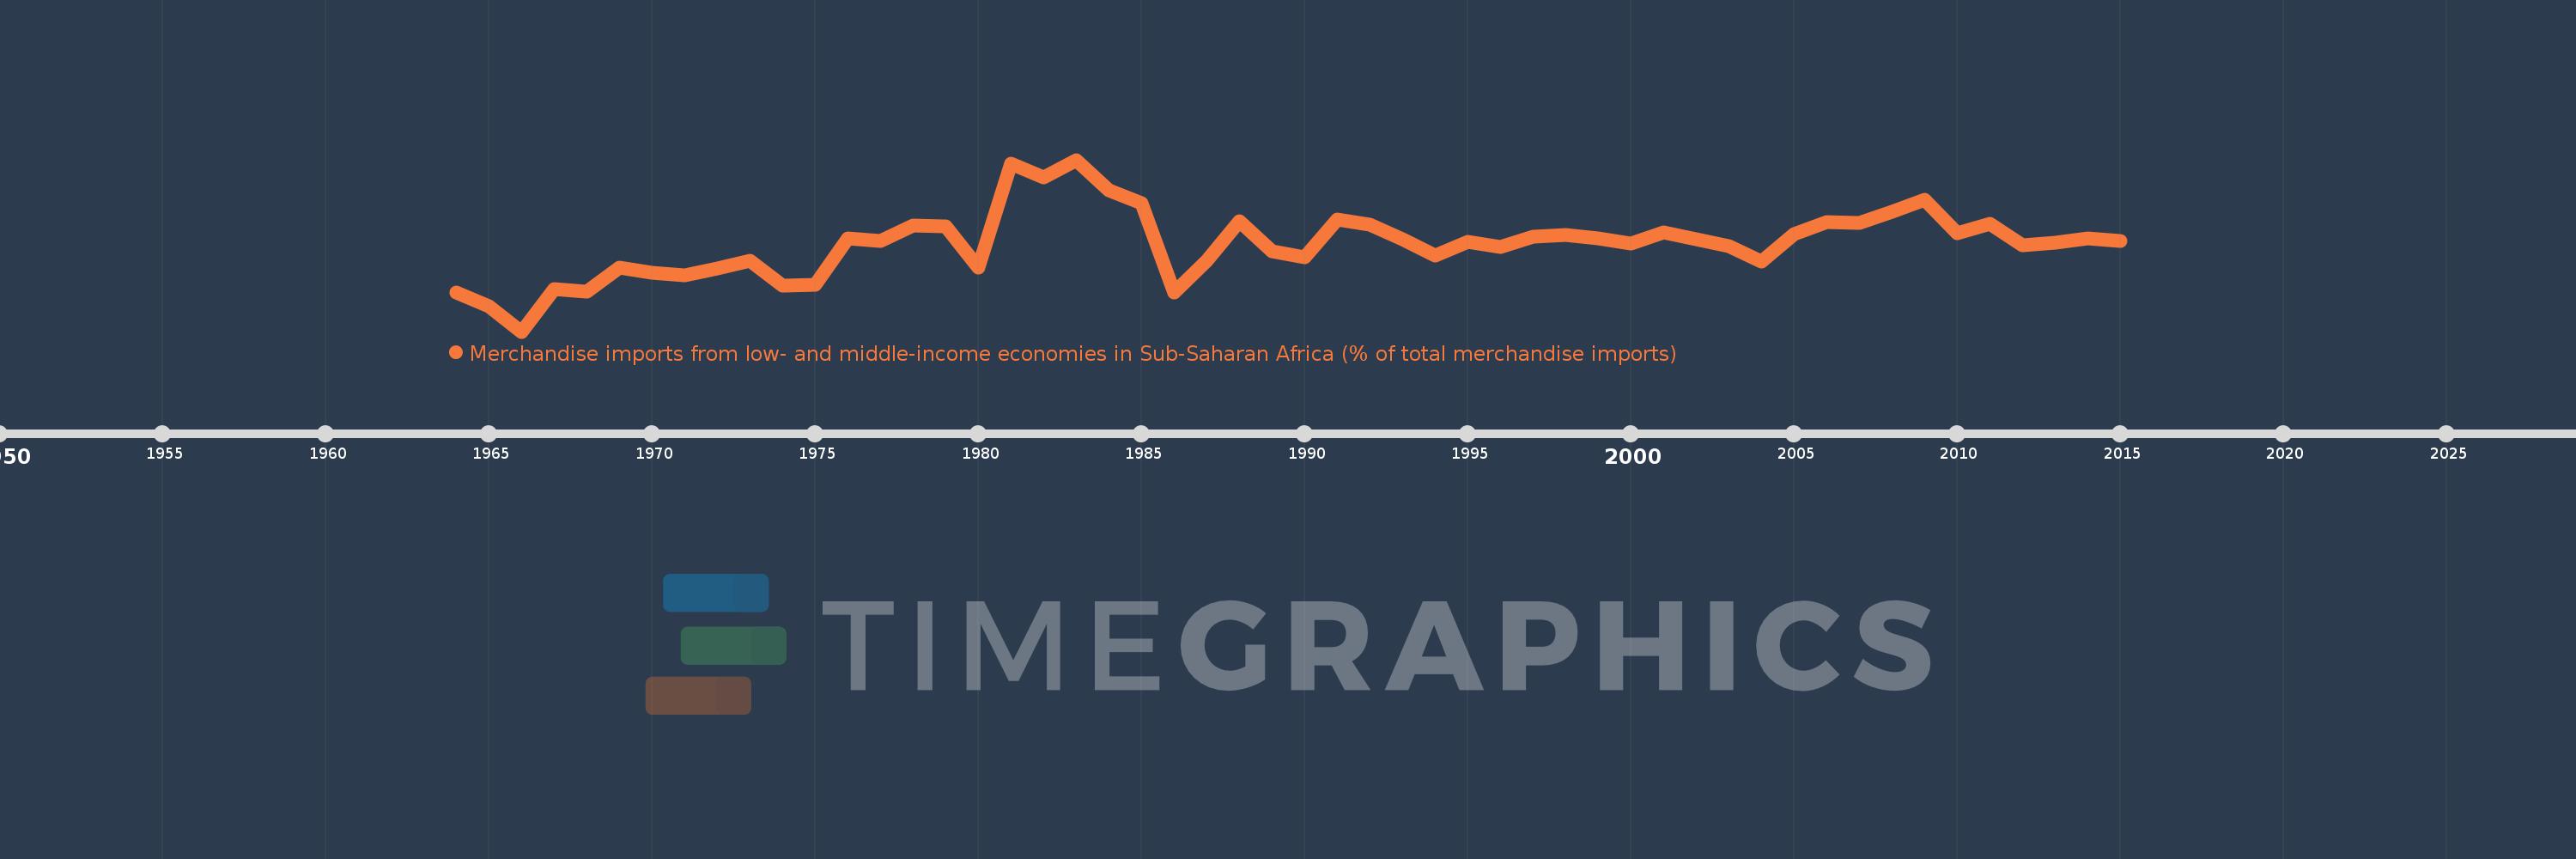
Merchandise imports from low- and middle-income economies in Sub-Saharan Africa (% of total merchandise imports)
2015,2014,2013,2012,2011,2010,2009,2008,2007,2006,2005,2004,2003,2002,2001,2000,1999,1998,1997,1996,1995,1994,1993,1992,1991,1990,1989,1988,1987,1986,1985,1984,1983,1982,1981,1980,1979,1978,1977,1976,1975,1974,1973,1972,1971,1970,1969,1968,1967,1966,1965,1964
Estas estadísticas en otros países:
AlbaniaAlgeriaAngolaArab WorldArgentinaArmeniaArubaAustraliaAustriaAzerbaijanBahamas, TheBahrainBangladeshBarbadosBelarusBelgiumBelizeBeninBermudaBoliviaBrazilBrunei DarussalamBulgariaBurkina FasoBurundiCabo VerdeCambodiaCameroonCanadaCaribbean small statesCentral African RepublicCentral Europe and the BalticsChadChileChinaColombiaCongo, Dem. Rep.Congo, Rep.Costa RicaCote d'IvoireCroatiaCubaCyprusCzech RepublicDenmarkDjiboutiDominicaDominican RepublicEarly-demographic dividendEast Asia & PacificEast Asia & Pacific (excluding high income)East Asia & Pacific (IDA & IBRD countries)EcuadorEgypt, Arab Rep.El SalvadorEstoniaEthiopiaEuro areaEurope & Central AsiaEurope & Central Asia (excluding high income)Europe & Central Asia (IDA & IBRD countries)European UnionFijiFinlandFragile and conflict affected situationsFranceGabonGambia, TheGeorgiaGermanyGhanaGreeceGreenlandGrenadaGuatemalaGuineaGuinea-BissauGuyanaHaitiHeavily indebted poor countries (HIPC)High incomeHondurasHong Kong SAR, ChinaHungaryIBRD onlyIcelandIDA & IBRD totalIDA blendIDA onlyIDA totalIndiaIndonesiaIran, Islamic Rep.IraqIrelandIsraelItalyJamaicaJapanJordanKazakhstanKenyaKorea, Dem. People’s Rep.Korea, Rep.KuwaitLao PDRLate-demographic dividendLatin America & Caribbean Latin America & Caribbean (excluding high income)Latin America & the Caribbean (IDA & IBRD countries)LatviaLeast developed countries: UN classificationLebanonLiberiaLibyaLithuaniaLow & middle incomeLow incomeLower middle incomeLuxembourgMacao SAR, ChinaMacedonia, FYRMadagascarMalawiMalaysiaMaliMaltaMauritaniaMauritiusMexicoMiddle East & North AfricaMiddle East & North Africa (excluding high income)Middle East & North Africa (IDA & IBRD countries)Middle incomeMoldovaMontenegroMoroccoMozambiqueMyanmarNetherlandsNew CaledoniaNew ZealandNicaraguaNigerNigeriaNorth AmericaNorwayOECD membersOmanOther small statesPacific island small statesPakistanPanamaPapua New GuineaParaguayPeruPhilippinesPolandPortugalPost-demographic dividendPre-demographic dividendQatarRomaniaRussian FederationRwandaSaudi ArabiaSenegalSerbiaSeychellesSierra LeoneSingaporeSlovak RepublicSloveniaSmall statesSomaliaSouth AfricaSouth AsiaSouth Asia (IDA & IBRD)SpainSri LankaSt. LuciaSt. Vincent and the GrenadinesSub-Saharan Africa Sub-Saharan Africa (excluding high income)Sub-Saharan Africa (IDA & IBRD countries)SudanSurinameSwedenSwitzerlandSyrian Arab RepublicTanzaniaThailandTogoTrinidad and TobagoTunisiaTurkeyUgandaUkraineUnited Arab EmiratesUnited KingdomUnited StatesUpper middle incomeUruguayVenezuela, RBVietnamWorldYemen, Rep.ZambiaZimbabwe línea de tiempo (timeline):
En esta escala de tiempo se presenta un gráfico de 1964 y 2015 de Mali. Los datos de 1963 están ausentes. El número de observaciones reales por fecha: 52.
Fuente (nombre):
Indicadores del desarrollo mundial
Fuente (organización):
World Bank staff estimates based data from International Monetary Fund's Direction of Trade database.
Categorías:
Private Sector, Trade
Se ha actualizado:
23 abr 2017 año
Los indicadores de los cambios de valor en los últimos años
Mínimo:
6.323
1 ene 1966 año
Máximo:
40.198
1 ene 1983 año
A la fecha de observación
Valor
Cambio absoluto
El cambio con respecto al valor anterior
1 ene 1964 año
14.076
+14.076
0.0%
1 ene 1965 año
11.295
-2.781
-19.76%
1 ene 1966 año
6.323
-4.972
-44.02%
1 ene 1967 año
14.667
+8.343
131.95%
1 ene 1968 año
14.23
-0.437
-2.98%
1 ene 1969 año
18.885
+4.655
32.72%
1 ene 1970 año
17.959
-0.926
-4.9%
1 ene 1971 año
17.403
-0.556
-3.1%
1 ene 1972 año
18.81
+1.407
8.08%
1 ene 1973 año
20.354
+1.544
8.21%
1 ene 1974 año
15.409
-4.945
-24.29%
1 ene 1975 año
15.589
+0.18
1.17%
1 ene 1976 año
24.643
+9.054
58.08%
1 ene 1977 año
24.205
-0.438
-1.78%
1 ene 1978 año
27.316
+3.111
12.85%
1 ene 1979 año
27.097
-0.218
-0.8%
1 ene 1980 año
19.013
-8.084
-29.83%
1 ene 1981 año
39.516
+20.503
107.84%
1 ene 1982 año
36.671
-2.845
-7.2%
1 ene 1983 año
40.198
+3.528
9.62%
1 ene 1984 año
34.234
-5.965
-14.84%
1 ene 1985 año
31.63
-2.603
-7.6%
1 ene 1986 año
13.947
-17.684
-55.91%
1 ene 1987 año
20.287
+6.341
45.46%
1 ene 1988 año
28.147
+7.86
38.74%
1 ene 1989 año
22.144
-6.003
-21.33%
1 ene 1990 año
20.963
-1.181
-5.33%
1 ene 1991 año
28.495
+7.532
35.93%
1 ene 1992 año
27.4
-1.095
-3.84%
1 ene 1993 año
24.552
-2.849
-10.4%
1 ene 1994 año
21.306
-3.246
-13.22%
1 ene 1995 año
23.939
+2.633
12.36%
1 ene 1996 año
23.079
-0.86
-3.59%
1 ene 1997 año
25.121
+2.042
8.85%
1 ene 1998 año
25.391
+0.27
1.07%
1 ene 1999 año
24.69
-0.701
-2.76%
1 ene 2000 año
23.75
-0.94
-3.81%
1 ene 2001 año
25.96
+2.21
9.31%
1 ene 2002 año
24.487
-1.472
-5.67%
1 ene 2003 año
23.174
-1.314
-5.37%
1 ene 2004 año
20.18
-2.994
-12.92%
1 ene 2005 año
25.477
+5.297
26.25%
1 ene 2006 año
27.956
+2.479
9.73%
1 ene 2007 año
27.791
-0.164
-0.59%
1 ene 2008 año
29.948
+2.157
7.76%
1 ene 2009 año
32.351
+2.403
8.02%
1 ene 2010 año
25.717
-6.635
-20.51%
1 ene 2011 año
27.657
+1.941
7.55%
1 ene 2012 año
23.371
-4.287
-15.5%
1 ene 2013 año
23.855
+0.484
2.07%
1 ene 2014 año
24.736
+0.881
3.69%
1 ene 2015 año
24.276
-0.46
-1.86%
Ranking de los países por los datos estadísticos actuales


Comentarios: