29
/es/
es
AIzaSyAYiBZKx7MnpbEhh9jyipgxe19OcubqV5w
April 1, 2024
247821
Spain
ESP
true
2
1
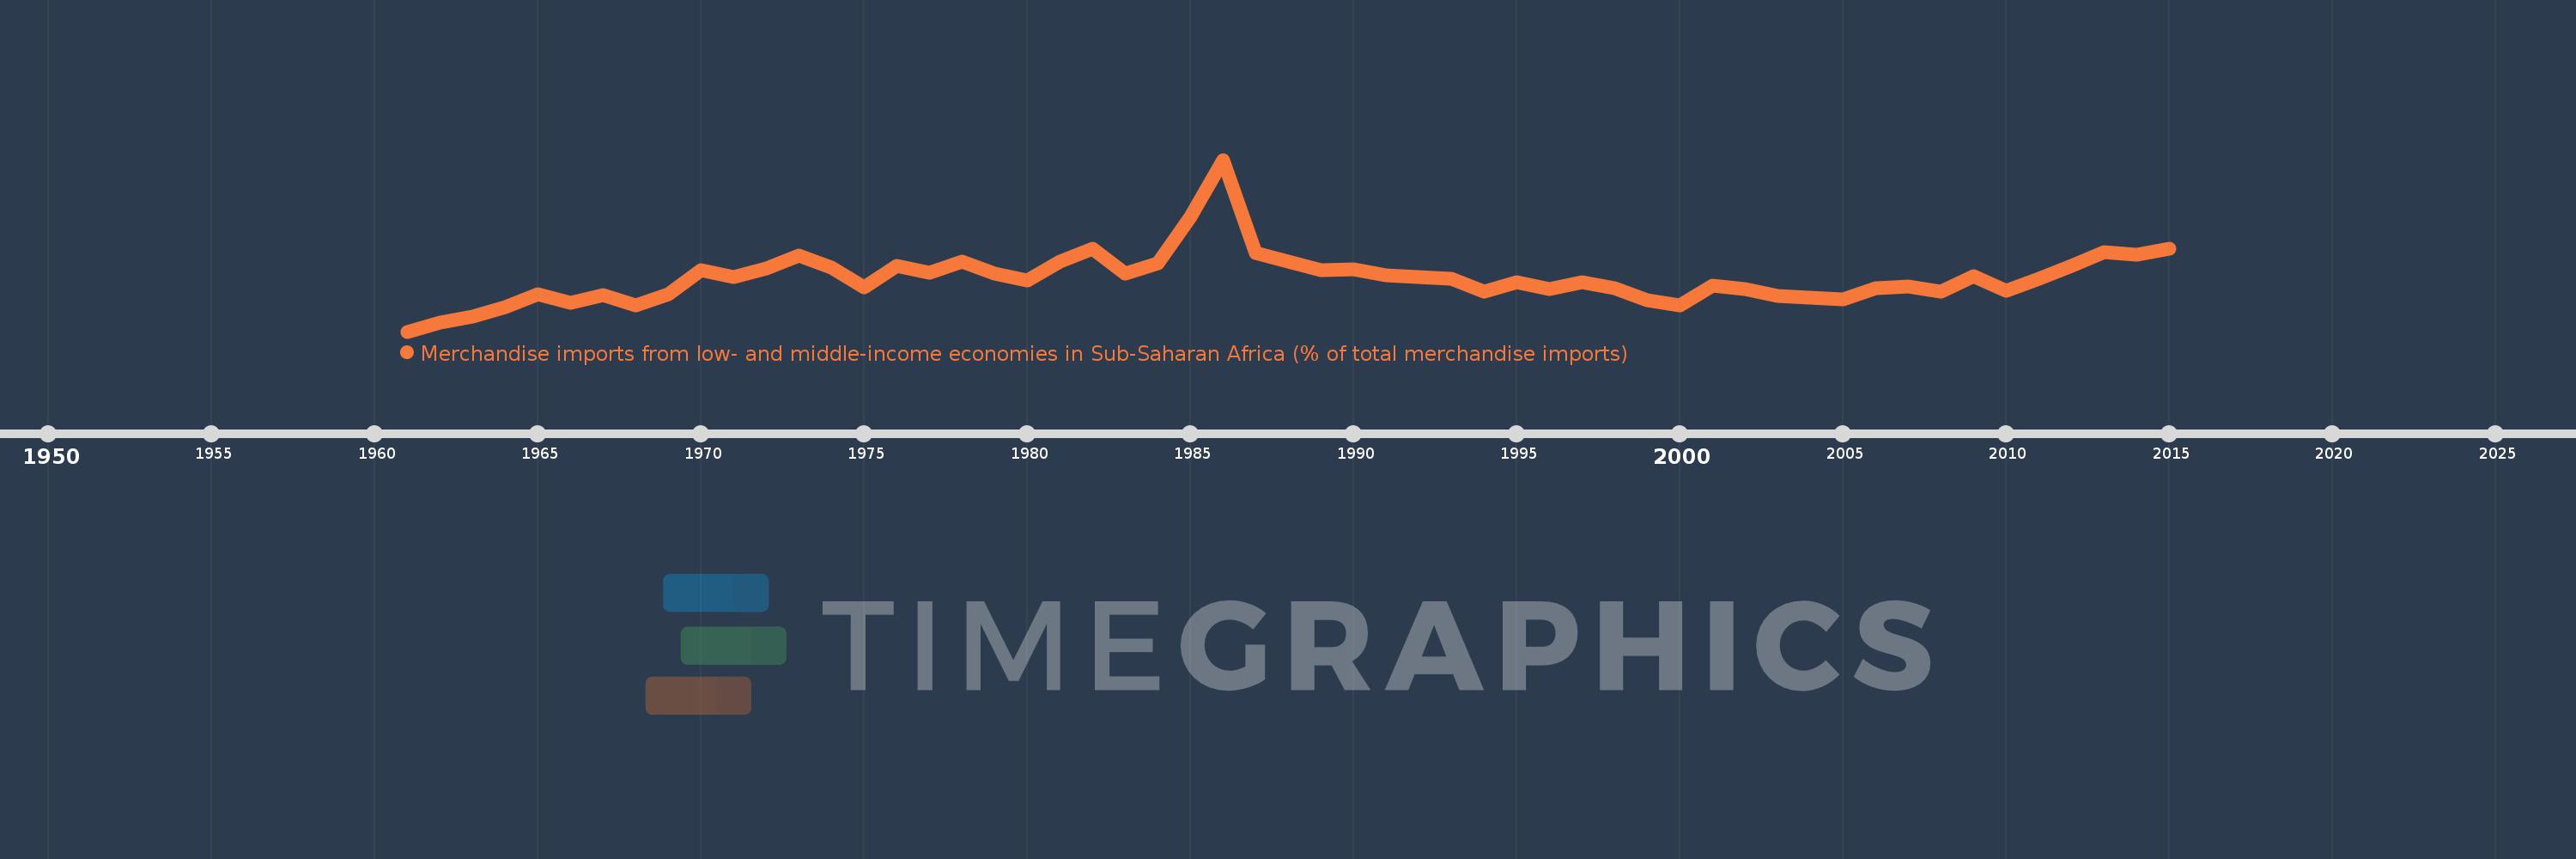
Merchandise imports from low- and middle-income economies in Sub-Saharan Africa (% of total merchandise imports)
2015,2014,2013,2012,2011,2010,2009,2008,2007,2006,2005,2004,2003,2002,2001,2000,1999,1998,1997,1996,1995,1994,1993,1992,1991,1990,1989,1988,1987,1986,1985,1984,1983,1982,1981,1980,1979,1978,1977,1976,1975,1974,1973,1972,1971,1970,1969,1968,1967,1966,1965,1964,1963,1962,1961
Estas estadísticas en otros países:
AlbaniaAlgeriaAngolaArab WorldArgentinaArmeniaArubaAustraliaAustriaAzerbaijanBahamas, TheBahrainBangladeshBarbadosBelarusBelgiumBelizeBeninBermudaBoliviaBrazilBrunei DarussalamBulgariaBurkina FasoBurundiCabo VerdeCambodiaCameroonCanadaCaribbean small statesCentral African RepublicCentral Europe and the BalticsChadChileChinaColombiaCongo, Dem. Rep.Congo, Rep.Costa RicaCote d'IvoireCroatiaCubaCyprusCzech RepublicDenmarkDjiboutiDominicaDominican RepublicEarly-demographic dividendEast Asia & PacificEast Asia & Pacific (excluding high income)East Asia & Pacific (IDA & IBRD countries)EcuadorEgypt, Arab Rep.El SalvadorEstoniaEthiopiaEuro areaEurope & Central AsiaEurope & Central Asia (excluding high income)Europe & Central Asia (IDA & IBRD countries)European UnionFijiFinlandFragile and conflict affected situationsFranceGabonGambia, TheGeorgiaGermanyGhanaGreeceGreenlandGrenadaGuatemalaGuineaGuinea-BissauGuyanaHaitiHeavily indebted poor countries (HIPC)High incomeHondurasHong Kong SAR, ChinaHungaryIBRD onlyIcelandIDA & IBRD totalIDA blendIDA onlyIDA totalIndiaIndonesiaIran, Islamic Rep.IraqIrelandIsraelItalyJamaicaJapanJordanKazakhstanKenyaKorea, Dem. People’s Rep.Korea, Rep.KuwaitLao PDRLate-demographic dividendLatin America & Caribbean Latin America & Caribbean (excluding high income)Latin America & the Caribbean (IDA & IBRD countries)LatviaLeast developed countries: UN classificationLebanonLiberiaLibyaLithuaniaLow & middle incomeLow incomeLower middle incomeLuxembourgMacao SAR, ChinaMacedonia, FYRMadagascarMalawiMalaysiaMaliMaltaMauritaniaMauritiusMexicoMiddle East & North AfricaMiddle East & North Africa (excluding high income)Middle East & North Africa (IDA & IBRD countries)Middle incomeMoldovaMontenegroMoroccoMozambiqueMyanmarNetherlandsNew CaledoniaNew ZealandNicaraguaNigerNigeriaNorth AmericaNorwayOECD membersOmanOther small statesPacific island small statesPakistanPanamaPapua New GuineaParaguayPeruPhilippinesPolandPortugalPost-demographic dividendPre-demographic dividendQatarRomaniaRussian FederationRwandaSaudi ArabiaSenegalSerbiaSeychellesSierra LeoneSingaporeSlovak RepublicSloveniaSmall statesSomaliaSouth AfricaSouth AsiaSouth Asia (IDA & IBRD)SpainSri LankaSt. LuciaSt. Vincent and the GrenadinesSub-Saharan Africa Sub-Saharan Africa (excluding high income)Sub-Saharan Africa (IDA & IBRD countries)SudanSurinameSwedenSwitzerlandSyrian Arab RepublicTanzaniaThailandTogoTrinidad and TobagoTunisiaTurkeyUgandaUkraineUnited Arab EmiratesUnited KingdomUnited StatesUpper middle incomeUruguayVenezuela, RBVietnamWorldYemen, Rep.ZambiaZimbabwe línea de tiempo (timeline):
En esta escala de tiempo se presenta un gráfico de 1961 y 2015 de Spain. Los datos de 1960 están ausentes. El número de observaciones reales por fecha: 55.
Fuente (nombre):
Indicadores del desarrollo mundial
Fuente (organización):
World Bank staff estimates based data from International Monetary Fund's Direction of Trade database.
Categorías:
Private Sector, Trade
Se ha actualizado:
23 abr 2017 año
Los indicadores de los cambios de valor en los últimos años
Mínimo:
0.984
1 ene 1961 año
Máximo:
8.631
1 ene 1986 año
A la fecha de observación
Valor
Cambio absoluto
El cambio con respecto al valor anterior
1 ene 1961 año
0.984
+0.984
0.0%
1 ene 1962 año
1.402
+0.418
42.53%
1 ene 1963 año
1.649
+0.246
17.57%
1 ene 1964 año
2.076
+0.427
25.92%
1 ene 1965 año
2.664
+0.588
28.31%
1 ene 1966 año
2.276
-0.388
-14.55%
1 ene 1967 año
2.608
+0.332
14.58%
1 ene 1968 año
2.154
-0.454
-17.41%
1 ene 1969 año
2.63
+0.476
22.11%
1 ene 1970 año
3.733
+1.103
41.93%
1 ene 1971 año
3.393
-0.34
-9.1%
1 ene 1972 año
3.797
+0.405
11.92%
1 ene 1973 año
4.365
+0.567
14.93%
1 ene 1974 año
3.817
-0.548
-12.55%
1 ene 1975 año
2.968
-0.849
-22.23%
1 ene 1976 año
3.906
+0.937
31.58%
1 ene 1977 año
3.599
-0.307
-7.86%
1 ene 1978 año
4.107
+0.508
14.12%
1 ene 1979 año
3.554
-0.553
-13.47%
1 ene 1980 año
3.26
-0.294
-8.26%
1 ene 1981 año
4.105
+0.845
25.92%
1 ene 1982 año
4.687
+0.581
14.16%
1 ene 1983 año
3.565
-1.122
-23.94%
1 ene 1984 año
4.007
+0.442
12.41%
1 ene 1985 año
6.085
+2.077
51.84%
1 ene 1986 año
8.631
+2.547
41.85%
1 ene 1987 año
4.482
-4.15
-48.08%
1 ene 1988 año
4.093
-0.389
-8.67%
1 ene 1989 año
3.718
-0.375
-9.15%
1 ene 1990 año
3.745
+0.026
0.7%
1 ene 1991 año
3.494
-0.25
-6.69%
1 ene 1992 año
3.404
-0.09
-2.59%
1 ene 1993 año
3.345
-0.059
-1.73%
1 ene 1994 año
2.772
-0.573
-17.12%
1 ene 1995 año
3.187
+0.415
14.97%
1 ene 1996 año
2.872
-0.315
-9.89%
1 ene 1997 año
3.199
+0.327
11.4%
1 ene 1998 año
2.921
-0.278
-8.7%
1 ene 1999 año
2.372
-0.549
-18.81%
1 ene 2000 año
2.151
-0.221
-9.31%
1 ene 2001 año
3.046
+0.895
41.61%
1 ene 2002 año
2.893
-0.153
-5.01%
1 ene 2003 año
2.586
-0.307
-10.62%
1 ene 2004 año
2.476
-0.11
-4.26%
1 ene 2005 año
2.414
-0.062
-2.49%
1 ene 2006 año
2.921
+0.507
21.01%
1 ene 2007 año
3.004
+0.083
2.83%
1 ene 2008 año
2.749
-0.255
-8.49%
1 ene 2009 año
3.441
+0.692
25.19%
1 ene 2010 año
2.784
-0.657
-19.09%
1 ene 2011 año
3.32
+0.536
19.23%
1 ene 2012 año
3.904
+0.585
17.61%
1 ene 2013 año
4.534
+0.63
16.13%
1 ene 2014 año
4.396
-0.138
-3.03%
1 ene 2015 año
4.658
+0.262
5.96%
Ranking de los países por los datos estadísticos actuales


Comentarios: