29
/es/
es
AIzaSyAYiBZKx7MnpbEhh9jyipgxe19OcubqV5w
April 1, 2024
109946
Congo, Dem. Rep.
COD
true
2
1
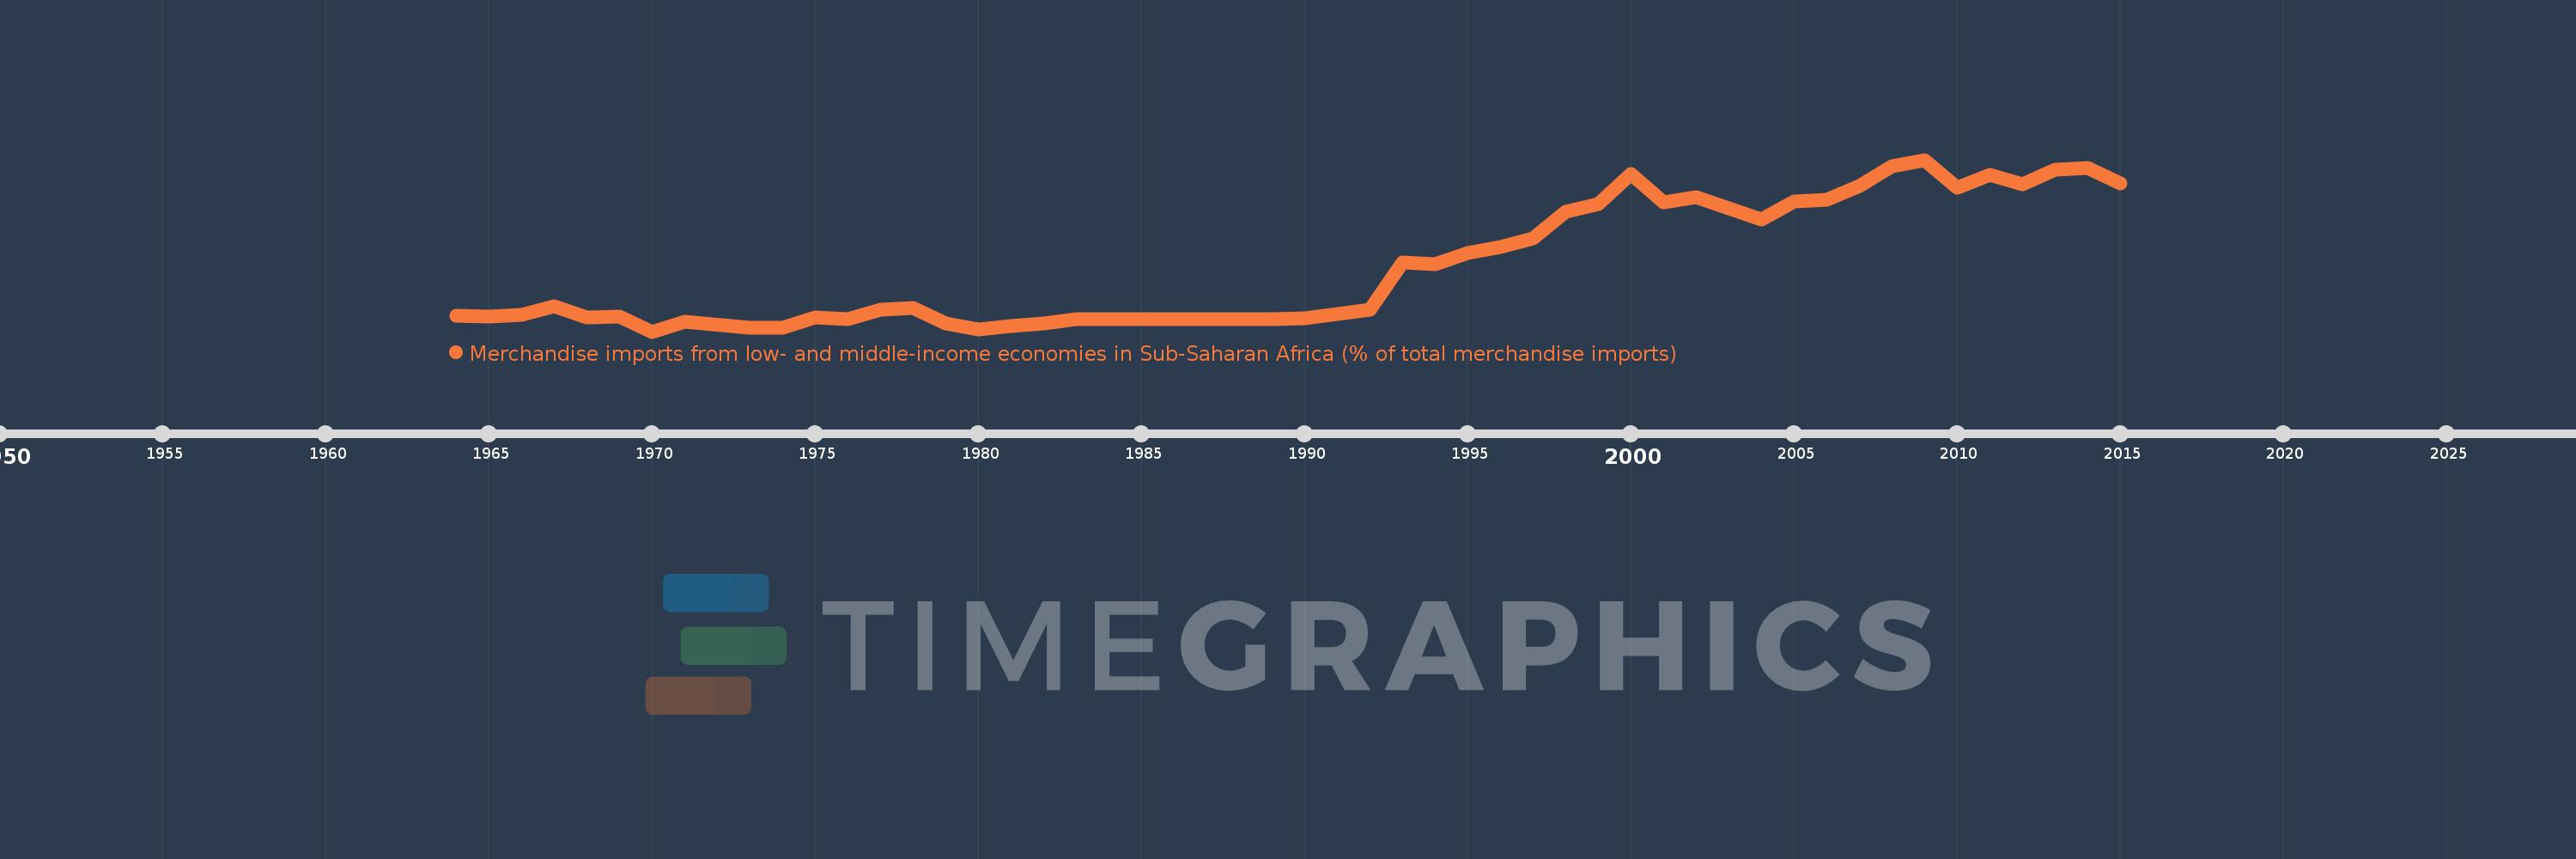
Merchandise imports from low- and middle-income economies in Sub-Saharan Africa (% of total merchandise imports)
2015,2014,2013,2012,2011,2010,2009,2008,2007,2006,2005,2004,2003,2002,2001,2000,1999,1998,1997,1996,1995,1994,1993,1992,1991,1990,1989,1988,1987,1986,1985,1984,1983,1982,1981,1980,1979,1978,1977,1976,1975,1974,1973,1971,1970,1969,1968,1967,1966,1965,1964
Estas estadísticas en otros países:
AlbaniaAlgeriaAngolaArab WorldArgentinaArmeniaArubaAustraliaAustriaAzerbaijanBahamas, TheBahrainBangladeshBarbadosBelarusBelgiumBelizeBeninBermudaBoliviaBrazilBrunei DarussalamBulgariaBurkina FasoBurundiCabo VerdeCambodiaCameroonCanadaCaribbean small statesCentral African RepublicCentral Europe and the BalticsChadChileChinaColombiaCongo, Dem. Rep.Congo, Rep.Costa RicaCote d'IvoireCroatiaCubaCyprusCzech RepublicDenmarkDjiboutiDominicaDominican RepublicEarly-demographic dividendEast Asia & PacificEast Asia & Pacific (excluding high income)East Asia & Pacific (IDA & IBRD countries)EcuadorEgypt, Arab Rep.El SalvadorEstoniaEthiopiaEuro areaEurope & Central AsiaEurope & Central Asia (excluding high income)Europe & Central Asia (IDA & IBRD countries)European UnionFijiFinlandFragile and conflict affected situationsFranceGabonGambia, TheGeorgiaGermanyGhanaGreeceGreenlandGrenadaGuatemalaGuineaGuinea-BissauGuyanaHaitiHeavily indebted poor countries (HIPC)High incomeHondurasHong Kong SAR, ChinaHungaryIBRD onlyIcelandIDA & IBRD totalIDA blendIDA onlyIDA totalIndiaIndonesiaIran, Islamic Rep.IraqIrelandIsraelItalyJamaicaJapanJordanKazakhstanKenyaKorea, Dem. People’s Rep.Korea, Rep.KuwaitLao PDRLate-demographic dividendLatin America & Caribbean Latin America & Caribbean (excluding high income)Latin America & the Caribbean (IDA & IBRD countries)LatviaLeast developed countries: UN classificationLebanonLiberiaLibyaLithuaniaLow & middle incomeLow incomeLower middle incomeLuxembourgMacao SAR, ChinaMacedonia, FYRMadagascarMalawiMalaysiaMaliMaltaMauritaniaMauritiusMexicoMiddle East & North AfricaMiddle East & North Africa (excluding high income)Middle East & North Africa (IDA & IBRD countries)Middle incomeMoldovaMontenegroMoroccoMozambiqueMyanmarNetherlandsNew CaledoniaNew ZealandNicaraguaNigerNigeriaNorth AmericaNorwayOECD membersOmanOther small statesPacific island small statesPakistanPanamaPapua New GuineaParaguayPeruPhilippinesPolandPortugalPost-demographic dividendPre-demographic dividendQatarRomaniaRussian FederationRwandaSaudi ArabiaSenegalSerbiaSeychellesSierra LeoneSingaporeSlovak RepublicSloveniaSmall statesSomaliaSouth AfricaSouth AsiaSouth Asia (IDA & IBRD)SpainSri LankaSt. LuciaSt. Vincent and the GrenadinesSub-Saharan Africa Sub-Saharan Africa (excluding high income)Sub-Saharan Africa (IDA & IBRD countries)SudanSurinameSwedenSwitzerlandSyrian Arab RepublicTanzaniaThailandTogoTrinidad and TobagoTunisiaTurkeyUgandaUkraineUnited Arab EmiratesUnited KingdomUnited StatesUpper middle incomeUruguayVenezuela, RBVietnamWorldYemen, Rep.ZambiaZimbabwe línea de tiempo (timeline):
En esta escala de tiempo se presenta un gráfico de 1964 y 2015 de Congo, Dem. Rep.. Los datos de 1963 están ausentes. El número de observaciones reales por fecha: 51.
Fuente (nombre):
Indicadores del desarrollo mundial
Fuente (organización):
World Bank staff estimates based data from International Monetary Fund's Direction of Trade database.
Categorías:
Private Sector, Trade
Se ha actualizado:
23 abr 2017 año
Los indicadores de los cambios de valor en los últimos años
Mínimo:
5.403
1 ene 1970 año
Máximo:
55.789
1 ene 2009 año
A la fecha de observación
Valor
Cambio absoluto
El cambio con respecto al valor anterior
1 ene 1964 año
9.958
+9.958
0.0%
1 ene 1965 año
9.82
-0.138
-1.39%
1 ene 1966 año
10.352
+0.533
5.43%
1 ene 1967 año
12.911
+2.558
24.71%
1 ene 1968 año
9.531
-3.38
-26.18%
1 ene 1969 año
9.877
+0.346
3.63%
1 ene 1970 año
5.403
-4.474
-45.3%
1 ene 1971 año
8.183
+2.78
51.46%
1 ene 1973 año
6.614
-1.57
-19.18%
1 ene 1974 año
6.471
-0.142
-2.15%
1 ene 1975 año
9.566
+3.094
47.82%
1 ene 1976 año
8.973
-0.593
-6.2%
1 ene 1977 año
11.71
+2.737
30.5%
1 ene 1978 año
12.369
+0.659
5.63%
1 ene 1979 año
7.829
-4.54
-36.71%
1 ene 1980 año
6.105
-1.724
-22.02%
1 ene 1981 año
6.964
+0.858
14.06%
1 ene 1982 año
7.717
+0.753
10.82%
1 ene 1983 año
9.146
+1.429
18.52%
1 ene 1984 año
9.146
0.0
0.0%
1 ene 1985 año
9.146
+0.0
0.0%
1 ene 1986 año
9.146
0.0
0.0%
1 ene 1987 año
9.146
+0.0
0.0%
1 ene 1988 año
9.146
+0.0
0.0%
1 ene 1989 año
9.146
+0.0
0.0%
1 ene 1990 año
9.403
+0.257
2.81%
1 ene 1991 año
10.603
+1.199
12.76%
1 ene 1992 año
11.888
+1.285
12.12%
1 ene 1993 año
25.612
+13.724
115.44%
1 ene 1994 año
25.292
-0.32
-1.25%
1 ene 1995 año
28.468
+3.176
12.56%
1 ene 1996 año
30.127
+1.658
5.83%
1 ene 1997 año
32.691
+2.564
8.51%
1 ene 1998 año
40.531
+7.841
23.98%
1 ene 1999 año
42.85
+2.319
5.72%
1 ene 2000 año
51.601
+8.751
20.42%
1 ene 2001 año
43.357
-8.244
-15.98%
1 ene 2002 año
44.775
+1.418
3.27%
1 ene 2003 año
41.451
-3.324
-7.42%
1 ene 2004 año
38.279
-3.171
-7.65%
1 ene 2005 año
43.623
+5.343
13.96%
1 ene 2006 año
44.198
+0.575
1.32%
1 ene 2007 año
48.147
+3.95
8.94%
1 ene 2008 año
53.953
+5.805
12.06%
1 ene 2009 año
55.789
+1.836
3.4%
1 ene 2010 año
47.629
-8.159
-14.63%
1 ene 2011 año
51.412
+3.783
7.94%
1 ene 2012 año
48.53
-2.882
-5.61%
1 ene 2013 año
52.933
+4.403
9.07%
1 ene 2014 año
53.52
+0.588
1.11%
1 ene 2015 año
48.826
-4.694
-8.77%
Ranking de los países por los datos estadísticos actuales


Comentarios: