29
/es/
es
AIzaSyAYiBZKx7MnpbEhh9jyipgxe19OcubqV5w
April 1, 2024
281281
Venezuela, RB
VEN
true
2
1
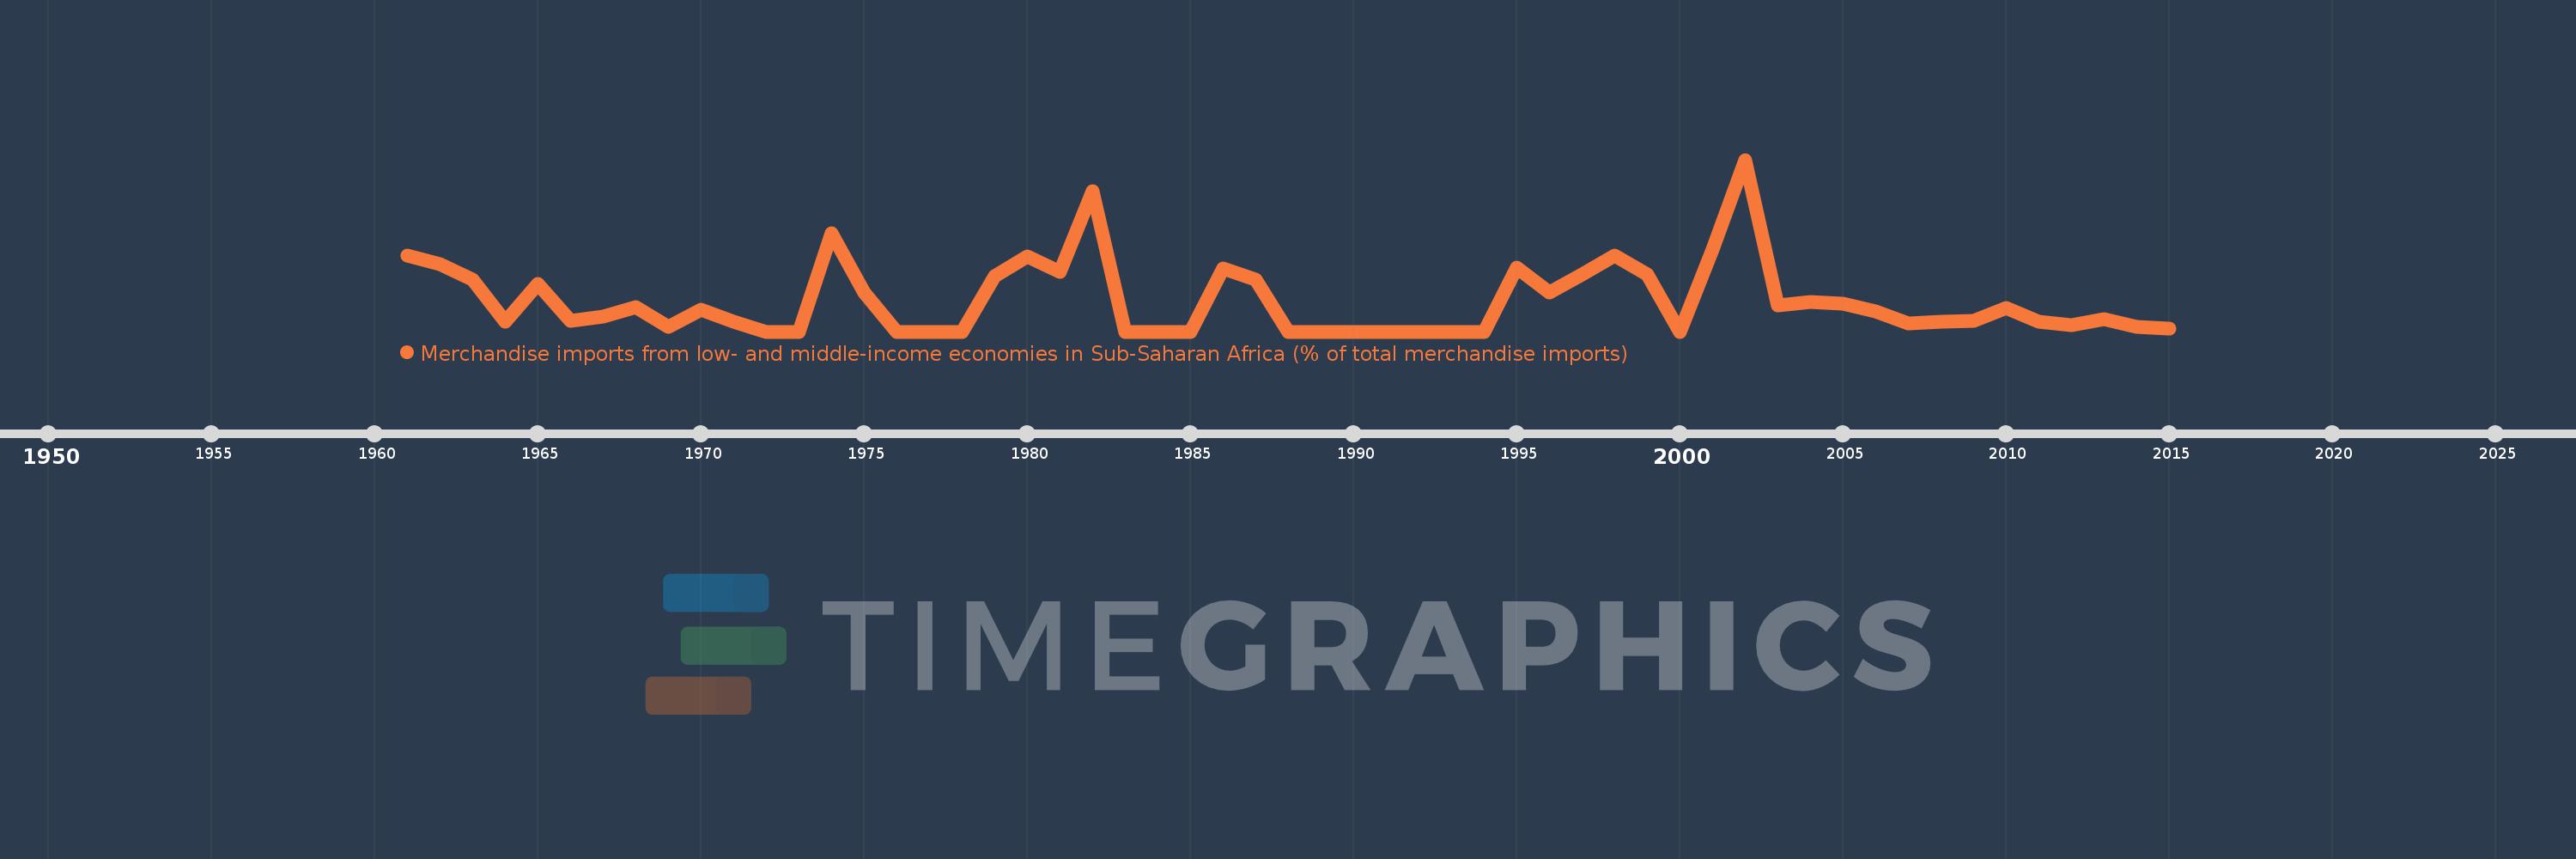
Merchandise imports from low- and middle-income economies in Sub-Saharan Africa (% of total merchandise imports)
2015,2014,2013,2012,2011,2010,2009,2008,2007,2006,2005,2004,2003,2002,2001,2000,1999,1998,1997,1996,1995,1994,1993,1992,1991,1990,1989,1988,1987,1986,1985,1984,1983,1982,1981,1980,1979,1978,1977,1976,1975,1974,1973,1972,1971,1970,1969,1968,1967,1966,1965,1964,1963,1962,1961
Estas estadísticas en otros países:
AlbaniaAlgeriaAngolaArab WorldArgentinaArmeniaArubaAustraliaAustriaAzerbaijanBahamas, TheBahrainBangladeshBarbadosBelarusBelgiumBelizeBeninBermudaBoliviaBrazilBrunei DarussalamBulgariaBurkina FasoBurundiCabo VerdeCambodiaCameroonCanadaCaribbean small statesCentral African RepublicCentral Europe and the BalticsChadChileChinaColombiaCongo, Dem. Rep.Congo, Rep.Costa RicaCote d'IvoireCroatiaCubaCyprusCzech RepublicDenmarkDjiboutiDominicaDominican RepublicEarly-demographic dividendEast Asia & PacificEast Asia & Pacific (excluding high income)East Asia & Pacific (IDA & IBRD countries)EcuadorEgypt, Arab Rep.El SalvadorEstoniaEthiopiaEuro areaEurope & Central AsiaEurope & Central Asia (excluding high income)Europe & Central Asia (IDA & IBRD countries)European UnionFijiFinlandFragile and conflict affected situationsFranceGabonGambia, TheGeorgiaGermanyGhanaGreeceGreenlandGrenadaGuatemalaGuineaGuinea-BissauGuyanaHaitiHeavily indebted poor countries (HIPC)High incomeHondurasHong Kong SAR, ChinaHungaryIBRD onlyIcelandIDA & IBRD totalIDA blendIDA onlyIDA totalIndiaIndonesiaIran, Islamic Rep.IraqIrelandIsraelItalyJamaicaJapanJordanKazakhstanKenyaKorea, Dem. People’s Rep.Korea, Rep.KuwaitLao PDRLate-demographic dividendLatin America & Caribbean Latin America & Caribbean (excluding high income)Latin America & the Caribbean (IDA & IBRD countries)LatviaLeast developed countries: UN classificationLebanonLiberiaLibyaLithuaniaLow & middle incomeLow incomeLower middle incomeLuxembourgMacao SAR, ChinaMacedonia, FYRMadagascarMalawiMalaysiaMaliMaltaMauritaniaMauritiusMexicoMiddle East & North AfricaMiddle East & North Africa (excluding high income)Middle East & North Africa (IDA & IBRD countries)Middle incomeMoldovaMontenegroMoroccoMozambiqueMyanmarNetherlandsNew CaledoniaNew ZealandNicaraguaNigerNigeriaNorth AmericaNorwayOECD membersOmanOther small statesPacific island small statesPakistanPanamaPapua New GuineaParaguayPeruPhilippinesPolandPortugalPost-demographic dividendPre-demographic dividendQatarRomaniaRussian FederationRwandaSaudi ArabiaSenegalSerbiaSeychellesSierra LeoneSingaporeSlovak RepublicSloveniaSmall statesSomaliaSouth AfricaSouth AsiaSouth Asia (IDA & IBRD)SpainSri LankaSt. LuciaSt. Vincent and the GrenadinesSub-Saharan Africa Sub-Saharan Africa (excluding high income)Sub-Saharan Africa (IDA & IBRD countries)SudanSurinameSwedenSwitzerlandSyrian Arab RepublicTanzaniaThailandTogoTrinidad and TobagoTunisiaTurkeyUgandaUkraineUnited Arab EmiratesUnited KingdomUnited StatesUpper middle incomeUruguayVenezuela, RBVietnamWorldYemen, Rep.ZambiaZimbabwe línea de tiempo (timeline):
En esta escala de tiempo se presenta un gráfico de 1961 y 2015 de Venezuela, RB. Los datos de 1960 están ausentes. El número de observaciones reales por fecha: 55.
Fuente (nombre):
Indicadores del desarrollo mundial
Fuente (organización):
World Bank staff estimates based data from International Monetary Fund's Direction of Trade database.
Categorías:
Private Sector, Trade
Se ha actualizado:
23 abr 2017 año
Los indicadores de los cambios de valor en los últimos años
Máximo:
1.121
1 ene 2002 año
A la fecha de observación
Valor
Cambio absoluto
El cambio con respecto al valor anterior
1 ene 1961 año
0.497
+0.497
0.0%
1 ene 1962 año
0.44
-0.056
-11.35%
1 ene 1963 año
0.34
-0.101
-22.9%
1 ene 1964 año
0.063
-0.277
-81.5%
1 ene 1965 año
0.309
+0.246
391.62%
1 ene 1966 año
0.069
-0.24
-77.72%
1 ene 1967 año
0.097
+0.028
41.28%
1 ene 1968 año
0.162
+0.065
67.08%
1 ene 1969 año
0.029
-0.133
-82.04%
1 ene 1970 año
0.145
+0.115
395.49%
1 ene 1971 año
0.066
-0.078
-54.07%
1 ene 1972 año
0.0
-0.066
-100.0%
1 ene 1974 año
0.642
+0.642
%
1 ene 1975 año
0.254
-0.388
-60.4%
1 ene 1976 año
0.0
-0.254
-100.0%
1 ene 1979 año
0.363
+0.363
%
1 ene 1980 año
0.492
+0.129
35.57%
1 ene 1981 año
0.389
-0.102
-20.82%
1 ene 1982 año
0.917
+0.527
135.45%
1 ene 1983 año
0.0
-0.917
-100.0%
1 ene 1986 año
0.411
+0.411
%
1 ene 1987 año
0.341
-0.07
-17.09%
1 ene 1988 año
0.0
-0.341
-100.0%
1 ene 1990 año
0.0
+0.0
100.14%
1 ene 1991 año
0.0
+0.0
61.01%
1 ene 1992 año
0.0
0.0
-100.0%
1 ene 1995 año
0.415
+0.415
%
1 ene 1996 año
0.254
-0.161
-38.69%
1 ene 1997 año
0.373
+0.119
46.67%
1 ene 1998 año
0.495
+0.122
32.65%
1 ene 1999 año
0.374
-0.121
-24.48%
1 ene 2000 año
0.0
-0.374
-100.0%
1 ene 2001 año
0.534
+0.534
%
1 ene 2002 año
1.121
+0.588
110.06%
1 ene 2003 año
0.17
-0.951
-84.8%
1 ene 2004 año
0.193
+0.023
13.27%
1 ene 2005 año
0.181
-0.012
-6.03%
1 ene 2006 año
0.132
-0.049
-27.0%
1 ene 2007 año
0.053
-0.08
-60.26%
1 ene 2008 año
0.064
+0.011
21.25%
1 ene 2009 año
0.07
+0.006
9.86%
1 ene 2010 año
0.154
+0.083
119.0%
1 ene 2011 año
0.062
-0.092
-59.61%
1 ene 2012 año
0.041
-0.021
-34.01%
1 ene 2013 año
0.083
+0.042
102.61%
1 ene 2014 año
0.029
-0.054
-64.68%
1 ene 2015 año
0.018
-0.011
-37.84%
Ranking de los países por los datos estadísticos actuales


Comentarios: