29
/es/
es
AIzaSyAYiBZKx7MnpbEhh9jyipgxe19OcubqV5w
April 1, 2024
249022
Sri Lanka
LKA
true
2
1
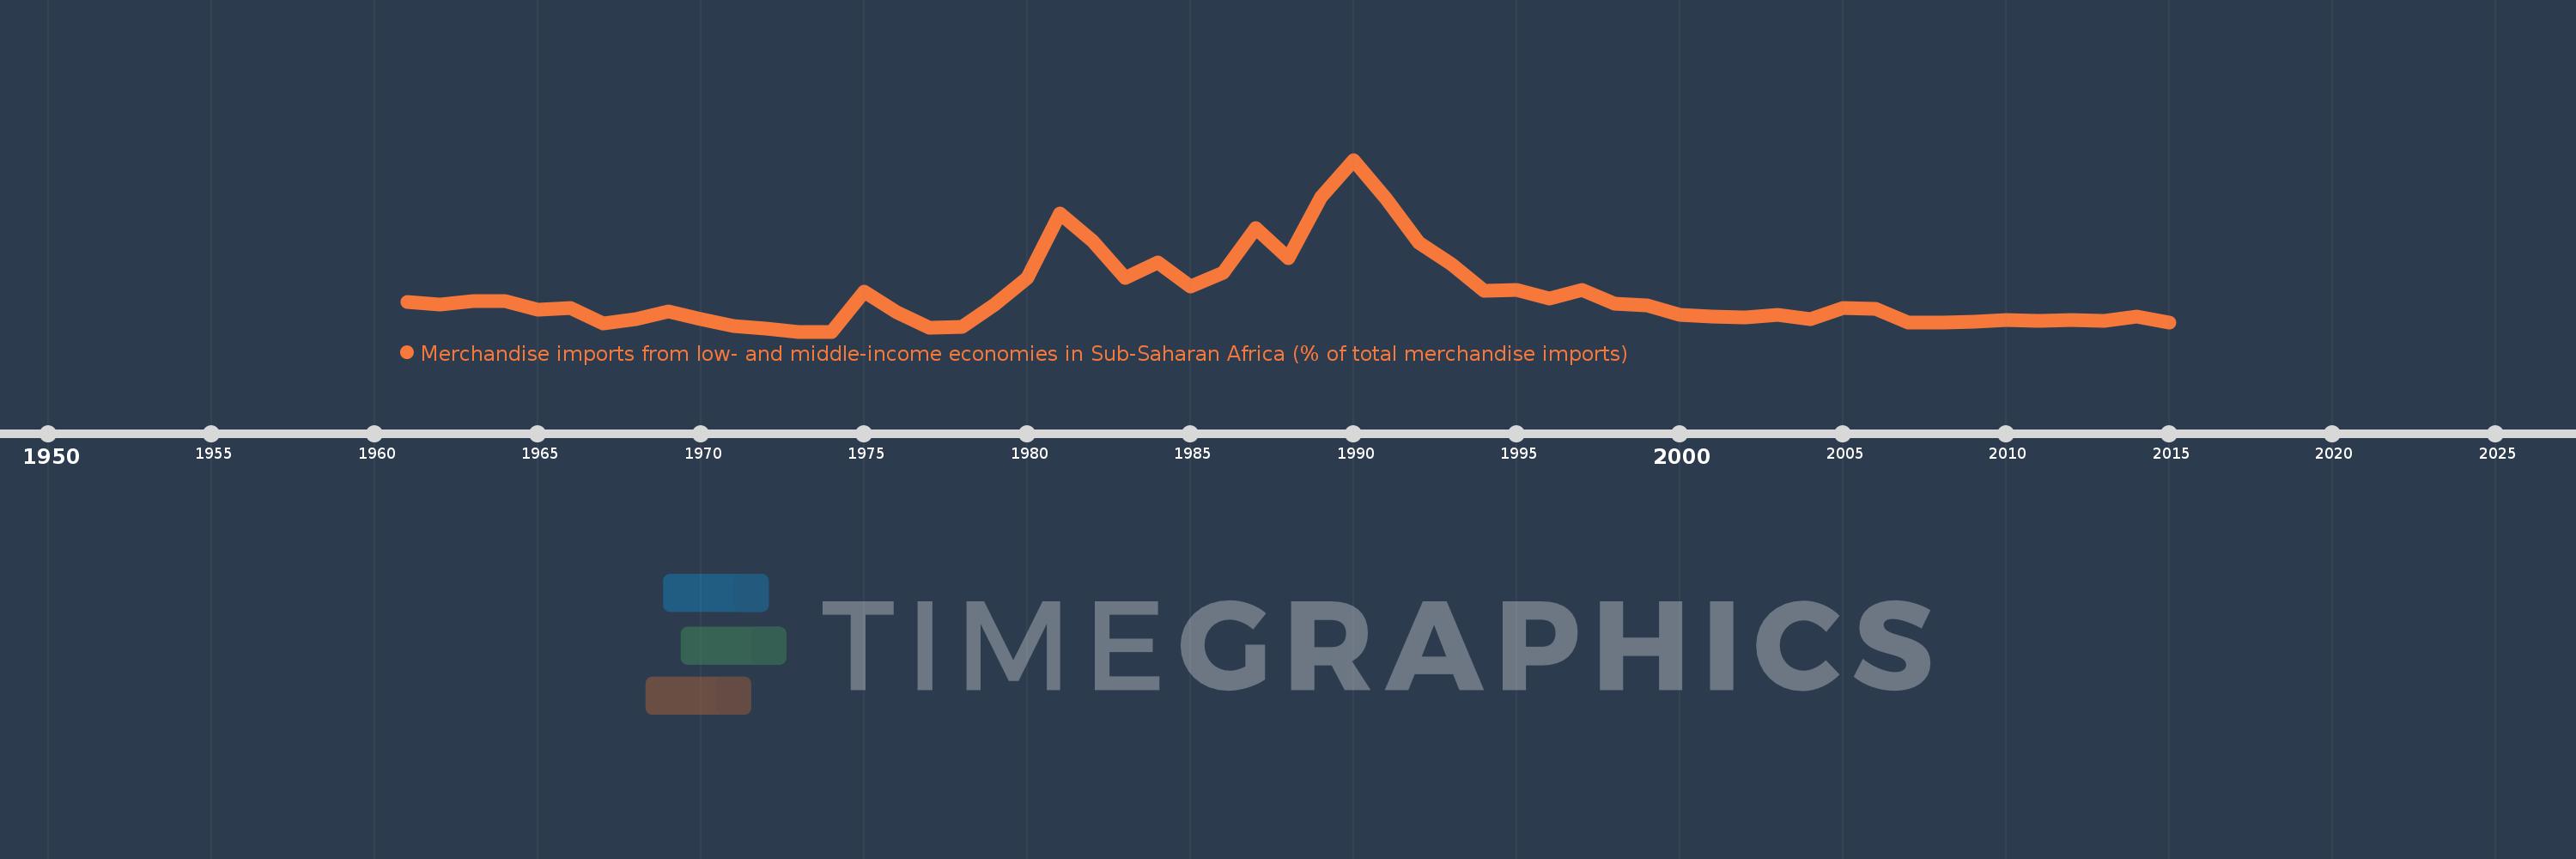
Merchandise imports from low- and middle-income economies in Sub-Saharan Africa (% of total merchandise imports)
2015,2014,2013,2012,2011,2010,2009,2008,2007,2006,2005,2004,2003,2002,2001,2000,1999,1998,1997,1996,1995,1994,1993,1992,1991,1990,1989,1988,1987,1986,1985,1984,1983,1982,1981,1980,1979,1978,1977,1976,1975,1974,1973,1972,1971,1970,1969,1968,1967,1966,1965,1964,1963,1962,1961
Estas estadísticas en otros países:
AlbaniaAlgeriaAngolaArab WorldArgentinaArmeniaArubaAustraliaAustriaAzerbaijanBahamas, TheBahrainBangladeshBarbadosBelarusBelgiumBelizeBeninBermudaBoliviaBrazilBrunei DarussalamBulgariaBurkina FasoBurundiCabo VerdeCambodiaCameroonCanadaCaribbean small statesCentral African RepublicCentral Europe and the BalticsChadChileChinaColombiaCongo, Dem. Rep.Congo, Rep.Costa RicaCote d'IvoireCroatiaCubaCyprusCzech RepublicDenmarkDjiboutiDominicaDominican RepublicEarly-demographic dividendEast Asia & PacificEast Asia & Pacific (excluding high income)East Asia & Pacific (IDA & IBRD countries)EcuadorEgypt, Arab Rep.El SalvadorEstoniaEthiopiaEuro areaEurope & Central AsiaEurope & Central Asia (excluding high income)Europe & Central Asia (IDA & IBRD countries)European UnionFijiFinlandFragile and conflict affected situationsFranceGabonGambia, TheGeorgiaGermanyGhanaGreeceGreenlandGrenadaGuatemalaGuineaGuinea-BissauGuyanaHaitiHeavily indebted poor countries (HIPC)High incomeHondurasHong Kong SAR, ChinaHungaryIBRD onlyIcelandIDA & IBRD totalIDA blendIDA onlyIDA totalIndiaIndonesiaIran, Islamic Rep.IraqIrelandIsraelItalyJamaicaJapanJordanKazakhstanKenyaKorea, Dem. People’s Rep.Korea, Rep.KuwaitLao PDRLate-demographic dividendLatin America & Caribbean Latin America & Caribbean (excluding high income)Latin America & the Caribbean (IDA & IBRD countries)LatviaLeast developed countries: UN classificationLebanonLiberiaLibyaLithuaniaLow & middle incomeLow incomeLower middle incomeLuxembourgMacao SAR, ChinaMacedonia, FYRMadagascarMalawiMalaysiaMaliMaltaMauritaniaMauritiusMexicoMiddle East & North AfricaMiddle East & North Africa (excluding high income)Middle East & North Africa (IDA & IBRD countries)Middle incomeMoldovaMontenegroMoroccoMozambiqueMyanmarNetherlandsNew CaledoniaNew ZealandNicaraguaNigerNigeriaNorth AmericaNorwayOECD membersOmanOther small statesPacific island small statesPakistanPanamaPapua New GuineaParaguayPeruPhilippinesPolandPortugalPost-demographic dividendPre-demographic dividendQatarRomaniaRussian FederationRwandaSaudi ArabiaSenegalSerbiaSeychellesSierra LeoneSingaporeSlovak RepublicSloveniaSmall statesSomaliaSouth AfricaSouth AsiaSouth Asia (IDA & IBRD)SpainSri LankaSt. LuciaSt. Vincent and the GrenadinesSub-Saharan Africa Sub-Saharan Africa (excluding high income)Sub-Saharan Africa (IDA & IBRD countries)SudanSurinameSwedenSwitzerlandSyrian Arab RepublicTanzaniaThailandTogoTrinidad and TobagoTunisiaTurkeyUgandaUkraineUnited Arab EmiratesUnited KingdomUnited StatesUpper middle incomeUruguayVenezuela, RBVietnamWorldYemen, Rep.ZambiaZimbabwe línea de tiempo (timeline):
En esta escala de tiempo se presenta un gráfico de 1961 y 2015 de Sri Lanka. Los datos de 1960 están ausentes. El número de observaciones reales por fecha: 55.
Fuente (nombre):
Indicadores del desarrollo mundial
Fuente (organización):
World Bank staff estimates based data from International Monetary Fund's Direction of Trade database.
Categorías:
Private Sector, Trade
Se ha actualizado:
23 abr 2017 año
Los indicadores de los cambios de valor en los últimos años
Máximo:
5.63
1 ene 1990 año
A la fecha de observación
Valor
Cambio absoluto
El cambio con respecto al valor anterior
1 ene 1961 año
0.978
+0.978
0.0%
1 ene 1962 año
0.875
-0.104
-10.58%
1 ene 1963 año
1.008
+0.133
15.21%
1 ene 1964 año
1.011
+0.003
0.27%
1 ene 1965 año
0.728
-0.282
-27.94%
1 ene 1966 año
0.78
+0.052
7.09%
1 ene 1967 año
0.258
-0.522
-66.89%
1 ene 1968 año
0.417
+0.159
61.46%
1 ene 1969 año
0.658
+0.241
57.72%
1 ene 1970 año
0.422
-0.236
-35.87%
1 ene 1971 año
0.179
-0.242
-57.44%
1 ene 1972 año
0.108
-0.072
-40.07%
1 ene 1973 año
0.0
-0.108
-100.0%
1 ene 1975 año
1.318
+1.318
%
1 ene 1976 año
0.647
-0.672
-50.93%
1 ene 1977 año
0.128
-0.519
-80.16%
1 ene 1978 año
0.165
+0.037
28.77%
1 ene 1979 año
0.883
+0.717
433.89%
1 ene 1980 año
1.763
+0.88
99.75%
1 ene 1981 año
3.873
+2.11
119.65%
1 ene 1982 año
2.975
-0.898
-23.19%
1 ene 1983 año
1.752
-1.223
-41.11%
1 ene 1984 año
2.277
+0.525
29.96%
1 ene 1985 año
1.475
-0.802
-35.22%
1 ene 1986 año
1.916
+0.442
29.95%
1 ene 1987 año
3.4
+1.484
77.43%
1 ene 1988 año
2.405
-0.995
-29.27%
1 ene 1989 año
4.399
+1.994
82.89%
1 ene 1990 año
5.63
+1.231
27.99%
1 ene 1991 año
4.362
-1.268
-22.53%
1 ene 1992 año
2.924
-1.438
-32.96%
1 ene 1993 año
2.21
-0.714
-24.42%
1 ene 1994 año
1.351
-0.859
-38.88%
1 ene 1995 año
1.371
+0.02
1.46%
1 ene 1996 año
1.094
-0.277
-20.21%
1 ene 1997 año
1.371
+0.278
25.4%
1 ene 1998 año
0.928
-0.444
-32.35%
1 ene 1999 año
0.862
-0.066
-7.07%
1 ene 2000 año
0.559
-0.303
-35.2%
1 ene 2001 año
0.503
-0.055
-9.91%
1 ene 2002 año
0.456
-0.047
-9.37%
1 ene 2003 año
0.562
+0.106
23.21%
1 ene 2004 año
0.421
-0.141
-25.17%
1 ene 2005 año
0.776
+0.355
84.44%
1 ene 2006 año
0.748
-0.027
-3.51%
1 ene 2007 año
0.295
-0.453
-60.54%
1 ene 2008 año
0.291
-0.004
-1.48%
1 ene 2009 año
0.329
+0.038
13.03%
1 ene 2010 año
0.391
+0.062
18.99%
1 ene 2011 año
0.341
-0.051
-12.95%
1 ene 2012 año
0.392
+0.051
14.94%
1 ene 2013 año
0.351
-0.041
-10.41%
1 ene 2014 año
0.495
+0.145
41.2%
1 ene 2015 año
0.303
-0.192
-38.81%
Ranking de los países por los datos estadísticos actuales


Comentarios: