29
/es/
es
AIzaSyAYiBZKx7MnpbEhh9jyipgxe19OcubqV5w
April 1, 2024
29289
East Asia & Pacific (IDA & IBRD countries)
TEA
false
2
1
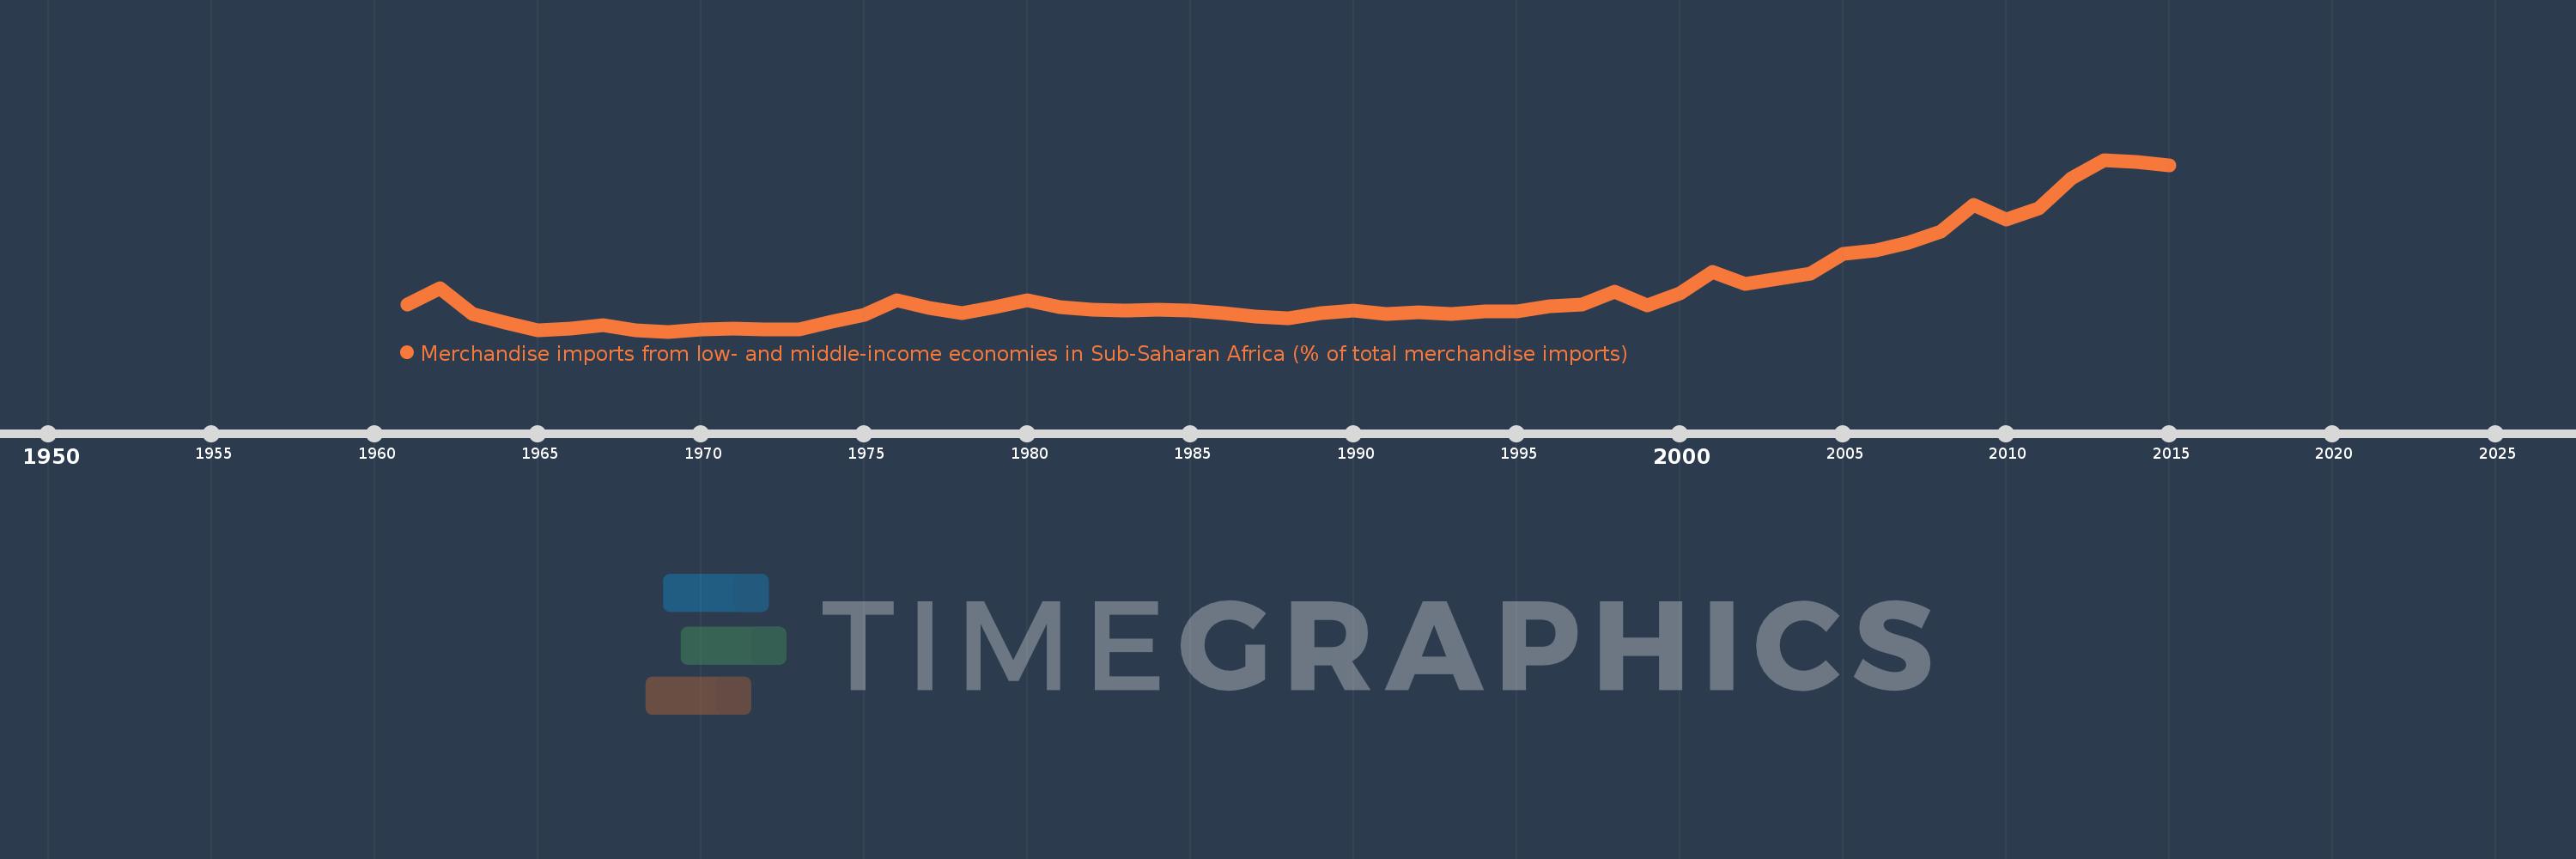
Merchandise imports from low- and middle-income economies in Sub-Saharan Africa (% of total merchandise imports)
2015,2014,2013,2012,2011,2010,2009,2008,2007,2006,2005,2004,2003,2002,2001,2000,1999,1998,1997,1996,1995,1994,1993,1992,1991,1990,1989,1988,1987,1986,1985,1984,1983,1982,1981,1980,1979,1978,1977,1976,1975,1974,1973,1972,1971,1970,1969,1968,1967,1966,1965,1964,1963,1962,1961
Estas estadísticas en otros países:
AlbaniaAlgeriaAngolaArab WorldArgentinaArmeniaArubaAustraliaAustriaAzerbaijanBahamas, TheBahrainBangladeshBarbadosBelarusBelgiumBelizeBeninBermudaBoliviaBrazilBrunei DarussalamBulgariaBurkina FasoBurundiCabo VerdeCambodiaCameroonCanadaCaribbean small statesCentral African RepublicCentral Europe and the BalticsChadChileChinaColombiaCongo, Dem. Rep.Congo, Rep.Costa RicaCote d'IvoireCroatiaCubaCyprusCzech RepublicDenmarkDjiboutiDominicaDominican RepublicEarly-demographic dividendEast Asia & PacificEast Asia & Pacific (excluding high income)East Asia & Pacific (IDA & IBRD countries)EcuadorEgypt, Arab Rep.El SalvadorEstoniaEthiopiaEuro areaEurope & Central AsiaEurope & Central Asia (excluding high income)Europe & Central Asia (IDA & IBRD countries)European UnionFijiFinlandFragile and conflict affected situationsFranceGabonGambia, TheGeorgiaGermanyGhanaGreeceGreenlandGrenadaGuatemalaGuineaGuinea-BissauGuyanaHaitiHeavily indebted poor countries (HIPC)High incomeHondurasHong Kong SAR, ChinaHungaryIBRD onlyIcelandIDA & IBRD totalIDA blendIDA onlyIDA totalIndiaIndonesiaIran, Islamic Rep.IraqIrelandIsraelItalyJamaicaJapanJordanKazakhstanKenyaKorea, Dem. People’s Rep.Korea, Rep.KuwaitLao PDRLate-demographic dividendLatin America & Caribbean Latin America & Caribbean (excluding high income)Latin America & the Caribbean (IDA & IBRD countries)LatviaLeast developed countries: UN classificationLebanonLiberiaLibyaLithuaniaLow & middle incomeLow incomeLower middle incomeLuxembourgMacao SAR, ChinaMacedonia, FYRMadagascarMalawiMalaysiaMaliMaltaMauritaniaMauritiusMexicoMiddle East & North AfricaMiddle East & North Africa (excluding high income)Middle East & North Africa (IDA & IBRD countries)Middle incomeMoldovaMontenegroMoroccoMozambiqueMyanmarNetherlandsNew CaledoniaNew ZealandNicaraguaNigerNigeriaNorth AmericaNorwayOECD membersOmanOther small statesPacific island small statesPakistanPanamaPapua New GuineaParaguayPeruPhilippinesPolandPortugalPost-demographic dividendPre-demographic dividendQatarRomaniaRussian FederationRwandaSaudi ArabiaSenegalSerbiaSeychellesSierra LeoneSingaporeSlovak RepublicSloveniaSmall statesSomaliaSouth AfricaSouth AsiaSouth Asia (IDA & IBRD)SpainSri LankaSt. LuciaSt. Vincent and the GrenadinesSub-Saharan Africa Sub-Saharan Africa (excluding high income)Sub-Saharan Africa (IDA & IBRD countries)SudanSurinameSwedenSwitzerlandSyrian Arab RepublicTanzaniaThailandTogoTrinidad and TobagoTunisiaTurkeyUgandaUkraineUnited Arab EmiratesUnited KingdomUnited StatesUpper middle incomeUruguayVenezuela, RBVietnamWorldYemen, Rep.ZambiaZimbabwe línea de tiempo (timeline):
En esta escala de tiempo se presenta un gráfico de 1961 y 2015 de East Asia & Pacific (IDA & IBRD countries). Los datos de 1960 están ausentes. El número de observaciones reales por fecha: 55.
Fuente (nombre):
Indicadores del desarrollo mundial
Fuente (organización):
World Bank staff estimates based data from International Monetary Fund's Direction of Trade database.
Categorías:
Private Sector, Trade
Se ha actualizado:
23 abr 2017 año
Los indicadores de los cambios de valor en los últimos años
Mínimo:
0.134
1 ene 1969 año
Máximo:
4.145
1 ene 2013 año
A la fecha de observación
Valor
Cambio absoluto
El cambio con respecto al valor anterior
1 ene 1961 año
0.769
+0.769
0.0%
1 ene 1962 año
1.149
+0.381
49.53%
1 ene 1963 año
0.555
-0.595
-51.76%
1 ene 1964 año
0.352
-0.202
-36.51%
1 ene 1965 año
0.17
-0.182
-51.72%
1 ene 1966 año
0.198
+0.028
16.76%
1 ene 1967 año
0.281
+0.082
41.4%
1 ene 1968 año
0.171
-0.11
-39.16%
1 ene 1969 año
0.134
-0.036
-21.35%
1 ene 1970 año
0.191
+0.057
42.08%
1 ene 1971 año
0.195
+0.004
2.22%
1 ene 1972 año
0.181
-0.014
-7.43%
1 ene 1973 año
0.194
+0.014
7.54%
1 ene 1974 año
0.374
+0.18
92.65%
1 ene 1975 año
0.519
+0.145
38.63%
1 ene 1976 año
0.868
+0.349
67.34%
1 ene 1977 año
0.688
-0.18
-20.76%
1 ene 1978 año
0.557
-0.131
-18.99%
1 ene 1979 año
0.707
+0.15
26.88%
1 ene 1980 año
0.861
+0.154
21.77%
1 ene 1981 año
0.707
-0.154
-17.9%
1 ene 1982 año
0.637
-0.07
-9.87%
1 ene 1983 año
0.628
-0.009
-1.41%
1 ene 1984 año
0.645
+0.017
2.72%
1 ene 1985 año
0.618
-0.027
-4.26%
1 ene 1986 año
0.573
-0.045
-7.23%
1 ene 1987 año
0.494
-0.079
-13.72%
1 ene 1988 año
0.454
-0.04
-8.16%
1 ene 1989 año
0.56
+0.106
23.33%
1 ene 1990 año
0.622
+0.062
11.01%
1 ene 1991 año
0.555
-0.067
-10.77%
1 ene 1992 año
0.576
+0.021
3.77%
1 ene 1993 año
0.536
-0.039
-6.81%
1 ene 1994 año
0.606
+0.07
13.0%
1 ene 1995 año
0.612
+0.006
0.96%
1 ene 1996 año
0.73
+0.118
19.29%
1 ene 1997 año
0.771
+0.041
5.56%
1 ene 1998 año
1.07
+0.3
38.89%
1 ene 1999 año
0.749
-0.321
-30.0%
1 ene 2000 año
1.018
+0.269
35.84%
1 ene 2001 año
1.524
+0.506
49.7%
1 ene 2002 año
1.248
-0.276
-18.11%
1 ene 2003 año
1.371
+0.124
9.92%
1 ene 2004 año
1.481
+0.11
8.0%
1 ene 2005 año
1.959
+0.478
32.26%
1 ene 2006 año
2.031
+0.072
3.7%
1 ene 2007 año
2.213
+0.182
8.96%
1 ene 2008 año
2.469
+0.256
11.56%
1 ene 2009 año
3.085
+0.616
24.94%
1 ene 2010 año
2.75
-0.335
-10.86%
1 ene 2011 año
3.004
+0.254
9.23%
1 ene 2012 año
3.722
+0.718
23.9%
1 ene 2013 año
4.145
+0.423
11.37%
1 ene 2014 año
4.089
-0.056
-1.35%
1 ene 2015 año
4.024
-0.065
-1.59%
Ranking de los países por los datos estadísticos actuales


Comentarios: