29
/es/
es
AIzaSyAYiBZKx7MnpbEhh9jyipgxe19OcubqV5w
April 1, 2024
267117
Trinidad and Tobago
TTO
true
2
1
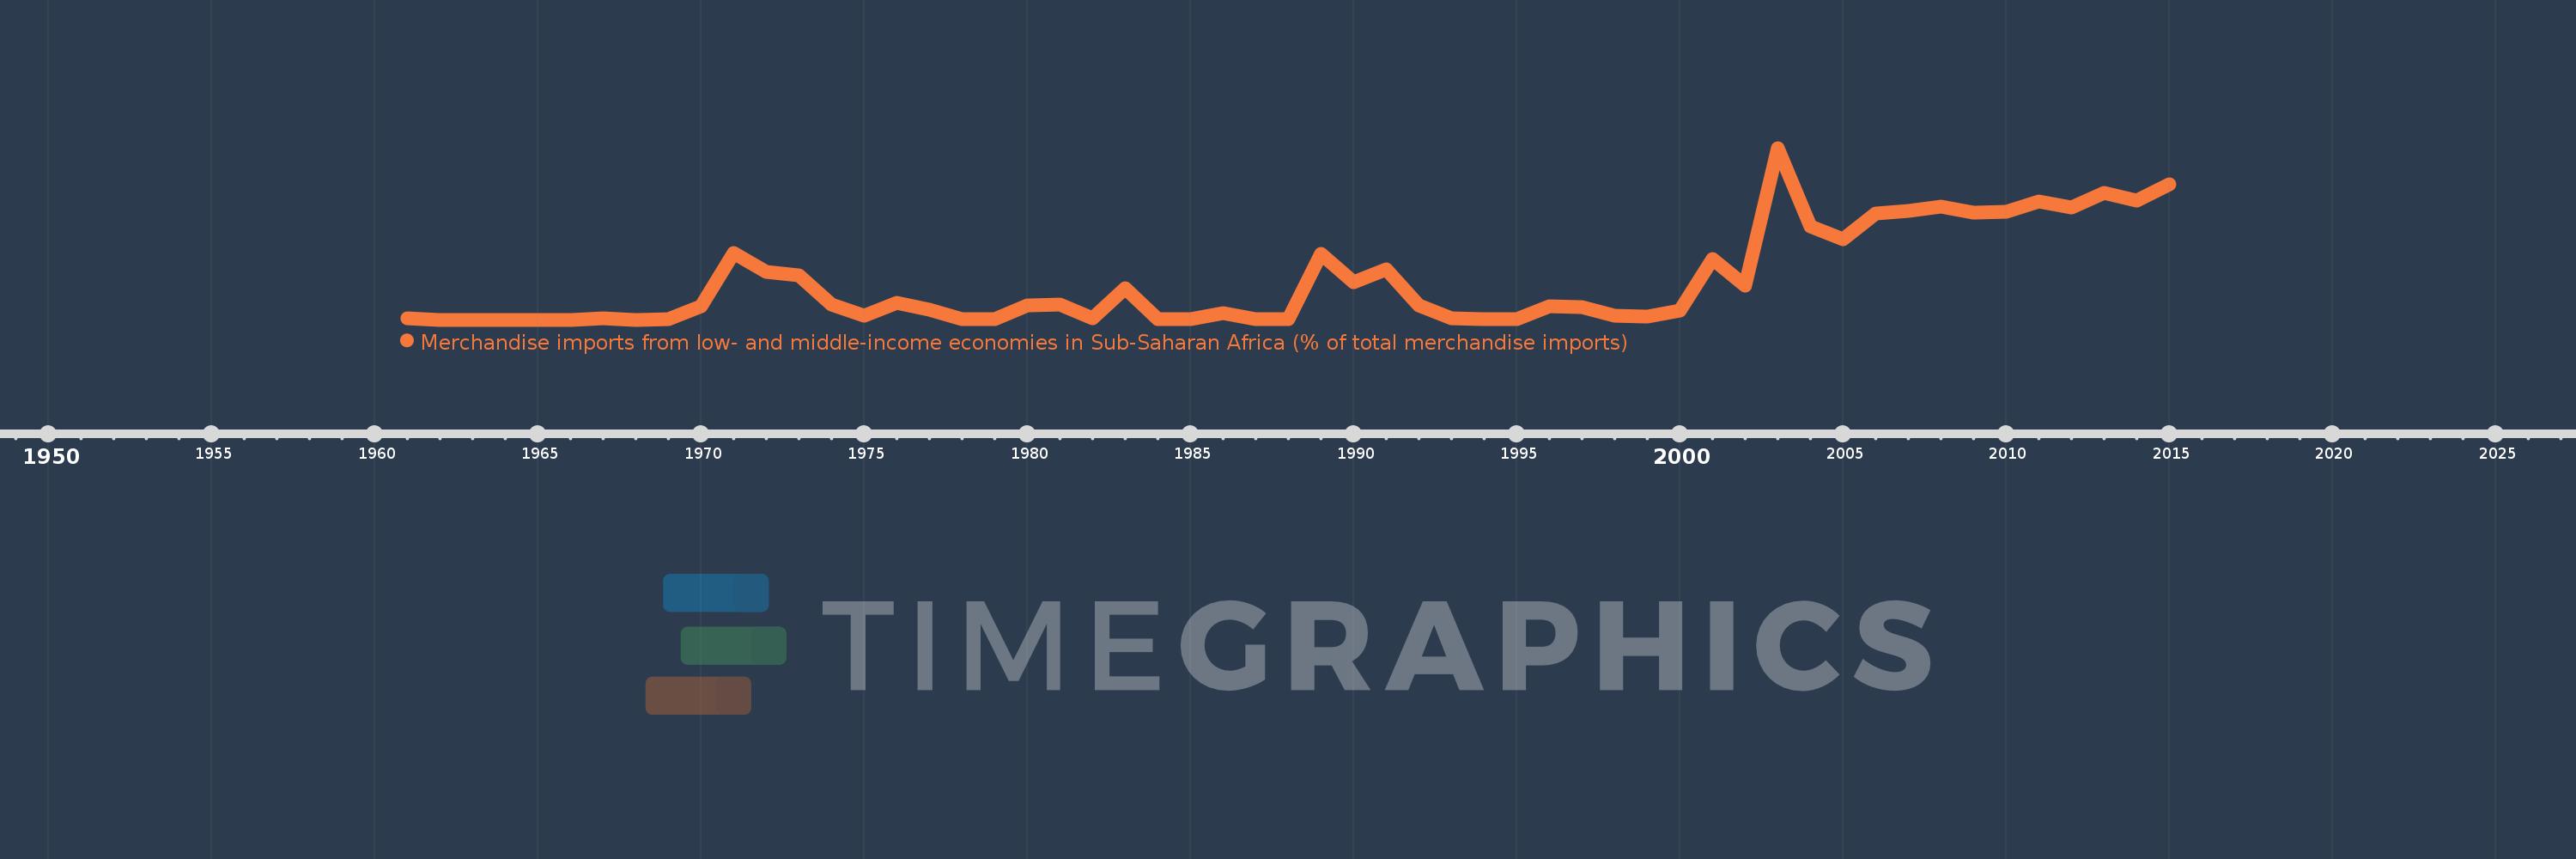
Merchandise imports from low- and middle-income economies in Sub-Saharan Africa (% of total merchandise imports)
2015,2014,2013,2012,2011,2010,2009,2008,2007,2006,2005,2004,2003,2002,2001,2000,1999,1998,1997,1996,1995,1994,1993,1992,1991,1990,1989,1988,1987,1986,1985,1984,1983,1982,1981,1980,1979,1978,1977,1976,1975,1974,1973,1972,1971,1970,1969,1968,1967,1966,1965,1964,1963,1962,1961
Estas estadísticas en otros países:
AlbaniaAlgeriaAngolaArab WorldArgentinaArmeniaArubaAustraliaAustriaAzerbaijanBahamas, TheBahrainBangladeshBarbadosBelarusBelgiumBelizeBeninBermudaBoliviaBrazilBrunei DarussalamBulgariaBurkina FasoBurundiCabo VerdeCambodiaCameroonCanadaCaribbean small statesCentral African RepublicCentral Europe and the BalticsChadChileChinaColombiaCongo, Dem. Rep.Congo, Rep.Costa RicaCote d'IvoireCroatiaCubaCyprusCzech RepublicDenmarkDjiboutiDominicaDominican RepublicEarly-demographic dividendEast Asia & PacificEast Asia & Pacific (excluding high income)East Asia & Pacific (IDA & IBRD countries)EcuadorEgypt, Arab Rep.El SalvadorEstoniaEthiopiaEuro areaEurope & Central AsiaEurope & Central Asia (excluding high income)Europe & Central Asia (IDA & IBRD countries)European UnionFijiFinlandFragile and conflict affected situationsFranceGabonGambia, TheGeorgiaGermanyGhanaGreeceGreenlandGrenadaGuatemalaGuineaGuinea-BissauGuyanaHaitiHeavily indebted poor countries (HIPC)High incomeHondurasHong Kong SAR, ChinaHungaryIBRD onlyIcelandIDA & IBRD totalIDA blendIDA onlyIDA totalIndiaIndonesiaIran, Islamic Rep.IraqIrelandIsraelItalyJamaicaJapanJordanKazakhstanKenyaKorea, Dem. People’s Rep.Korea, Rep.KuwaitLao PDRLate-demographic dividendLatin America & Caribbean Latin America & Caribbean (excluding high income)Latin America & the Caribbean (IDA & IBRD countries)LatviaLeast developed countries: UN classificationLebanonLiberiaLibyaLithuaniaLow & middle incomeLow incomeLower middle incomeLuxembourgMacao SAR, ChinaMacedonia, FYRMadagascarMalawiMalaysiaMaliMaltaMauritaniaMauritiusMexicoMiddle East & North AfricaMiddle East & North Africa (excluding high income)Middle East & North Africa (IDA & IBRD countries)Middle incomeMoldovaMontenegroMoroccoMozambiqueMyanmarNetherlandsNew CaledoniaNew ZealandNicaraguaNigerNigeriaNorth AmericaNorwayOECD membersOmanOther small statesPacific island small statesPakistanPanamaPapua New GuineaParaguayPeruPhilippinesPolandPortugalPost-demographic dividendPre-demographic dividendQatarRomaniaRussian FederationRwandaSaudi ArabiaSenegalSerbiaSeychellesSierra LeoneSingaporeSlovak RepublicSloveniaSmall statesSomaliaSouth AfricaSouth AsiaSouth Asia (IDA & IBRD)SpainSri LankaSt. LuciaSt. Vincent and the GrenadinesSub-Saharan Africa Sub-Saharan Africa (excluding high income)Sub-Saharan Africa (IDA & IBRD countries)SudanSurinameSwedenSwitzerlandSyrian Arab RepublicTanzaniaThailandTogoTrinidad and TobagoTunisiaTurkeyUgandaUkraineUnited Arab EmiratesUnited KingdomUnited StatesUpper middle incomeUruguayVenezuela, RBVietnamWorldYemen, Rep.ZambiaZimbabwe línea de tiempo (timeline):
En esta escala de tiempo se presenta un gráfico de 1961 y 2015 de Trinidad and Tobago. Los datos de 1960 están ausentes. El número de observaciones reales por fecha: 55.
Fuente (nombre):
Indicadores del desarrollo mundial
Fuente (organización):
World Bank staff estimates based data from International Monetary Fund's Direction of Trade database.
Categorías:
Private Sector, Trade
Se ha actualizado:
23 abr 2017 año
Los indicadores de los cambios de valor en los últimos años
Máximo:
10.917
1 ene 2003 año
A la fecha de observación
Valor
Cambio absoluto
El cambio con respecto al valor anterior
1 ene 1961 año
0.068
+0.068
0.0%
1 ene 1962 año
0.0
-0.068
-100.0%
1 ene 1967 año
0.087
+0.087
%
1 ene 1968 año
0.0
-0.087
-100.0%
1 ene 1969 año
0.024
+0.024
%
1 ene 1970 año
0.855
+0.831
3.49 mil%
1 ene 1971 año
4.241
+3.387
396.21%
1 ene 1972 año
3.018
-1.224
-28.85%
1 ene 1973 año
2.834
-0.184
-6.09%
1 ene 1974 año
0.988
-1.846
-65.13%
1 ene 1975 año
0.23
-0.759
-76.77%
1 ene 1976 año
1.075
+0.845
368.29%
1 ene 1977 año
0.628
-0.447
-41.57%
1 ene 1978 año
0.045
-0.583
-92.88%
1 ene 1979 año
0.019
-0.025
-56.67%
1 ene 1980 año
0.892
+0.872
4.5 mil%
1 ene 1981 año
0.939
+0.047
5.27%
1 ene 1982 año
0.067
-0.872
-92.85%
1 ene 1983 año
1.989
+1.922
2.87 mil%
1 ene 1984 año
0.058
-1.931
-97.07%
1 ene 1985 año
0.017
-0.041
-70.26%
1 ene 1986 año
0.439
+0.421
2.43 mil%
1 ene 1987 año
0.016
-0.423
-96.41%
1 ene 1988 año
0.018
+0.002
14.25%
1 ene 1989 año
4.202
+4.184
23.23 mil%
1 ene 1990 año
2.386
-1.816
-43.22%
1 ene 1991 año
3.177
+0.791
33.14%
1 ene 1992 año
0.928
-2.249
-70.79%
1 ene 1993 año
0.082
-0.846
-91.17%
1 ene 1994 año
0.036
-0.045
-55.49%
1 ene 1995 año
0.062
+0.025
69.25%
1 ene 1996 año
0.877
+0.816
1.32 mil%
1 ene 1997 año
0.794
-0.084
-9.53%
1 ene 1998 año
0.249
-0.545
-68.68%
1 ene 1999 año
0.186
-0.063
-25.25%
1 ene 2000 año
0.589
+0.403
216.97%
1 ene 2001 año
3.843
+3.254
552.42%
1 ene 2002 año
2.177
-1.666
-43.36%
1 ene 2003 año
10.917
+8.741
401.54%
1 ene 2004 año
5.934
-4.984
-45.65%
1 ene 2005 año
5.098
-0.835
-14.08%
1 ene 2006 año
6.767
+1.669
32.73%
1 ene 2007 año
6.89
+0.123
1.82%
1 ene 2008 año
7.171
+0.281
4.08%
1 ene 2009 año
6.787
-0.384
-5.36%
1 ene 2010 año
6.887
+0.101
1.48%
1 ene 2011 año
7.543
+0.656
9.52%
1 ene 2012 año
7.129
-0.415
-5.5%
1 ene 2013 año
8.067
+0.938
13.16%
1 ene 2014 año
7.589
-0.478
-5.92%
1 ene 2015 año
8.622
+1.033
13.62%
Ranking de los países por los datos estadísticos actuales


Comentarios: