29
/es/
es
AIzaSyAYiBZKx7MnpbEhh9jyipgxe19OcubqV5w
April 1, 2024
261198
Tanzania
TZA
true
2
1
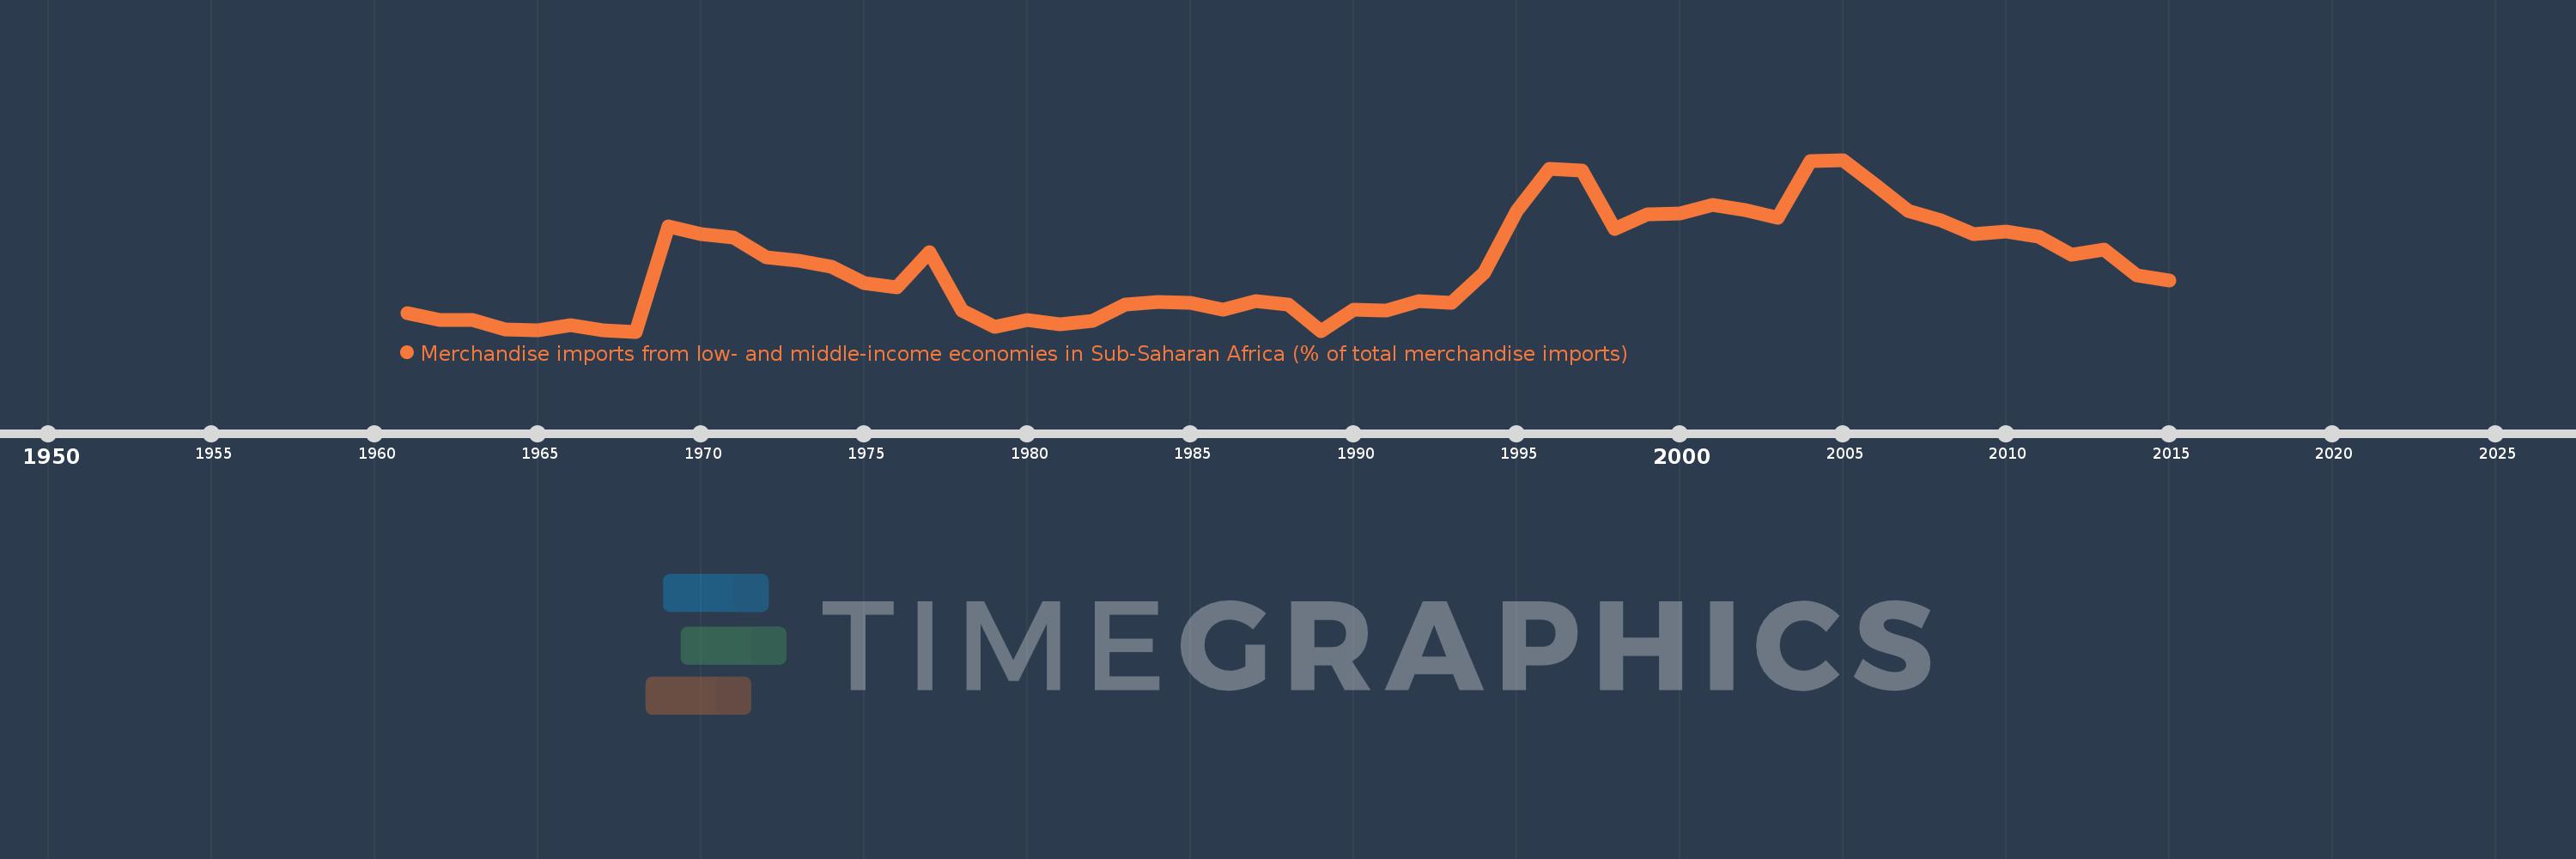
Merchandise imports from low- and middle-income economies in Sub-Saharan Africa (% of total merchandise imports)
2015,2014,2013,2012,2011,2010,2009,2008,2007,2006,2005,2004,2003,2002,2001,2000,1999,1998,1997,1996,1995,1994,1993,1992,1991,1990,1989,1988,1987,1986,1985,1984,1983,1982,1981,1980,1979,1978,1977,1976,1975,1974,1973,1972,1971,1970,1969,1968,1967,1966,1965,1964,1963,1962,1961
Estas estadísticas en otros países:
AlbaniaAlgeriaAngolaArab WorldArgentinaArmeniaArubaAustraliaAustriaAzerbaijanBahamas, TheBahrainBangladeshBarbadosBelarusBelgiumBelizeBeninBermudaBoliviaBrazilBrunei DarussalamBulgariaBurkina FasoBurundiCabo VerdeCambodiaCameroonCanadaCaribbean small statesCentral African RepublicCentral Europe and the BalticsChadChileChinaColombiaCongo, Dem. Rep.Congo, Rep.Costa RicaCote d'IvoireCroatiaCubaCyprusCzech RepublicDenmarkDjiboutiDominicaDominican RepublicEarly-demographic dividendEast Asia & PacificEast Asia & Pacific (excluding high income)East Asia & Pacific (IDA & IBRD countries)EcuadorEgypt, Arab Rep.El SalvadorEstoniaEthiopiaEuro areaEurope & Central AsiaEurope & Central Asia (excluding high income)Europe & Central Asia (IDA & IBRD countries)European UnionFijiFinlandFragile and conflict affected situationsFranceGabonGambia, TheGeorgiaGermanyGhanaGreeceGreenlandGrenadaGuatemalaGuineaGuinea-BissauGuyanaHaitiHeavily indebted poor countries (HIPC)High incomeHondurasHong Kong SAR, ChinaHungaryIBRD onlyIcelandIDA & IBRD totalIDA blendIDA onlyIDA totalIndiaIndonesiaIran, Islamic Rep.IraqIrelandIsraelItalyJamaicaJapanJordanKazakhstanKenyaKorea, Dem. People’s Rep.Korea, Rep.KuwaitLao PDRLate-demographic dividendLatin America & Caribbean Latin America & Caribbean (excluding high income)Latin America & the Caribbean (IDA & IBRD countries)LatviaLeast developed countries: UN classificationLebanonLiberiaLibyaLithuaniaLow & middle incomeLow incomeLower middle incomeLuxembourgMacao SAR, ChinaMacedonia, FYRMadagascarMalawiMalaysiaMaliMaltaMauritaniaMauritiusMexicoMiddle East & North AfricaMiddle East & North Africa (excluding high income)Middle East & North Africa (IDA & IBRD countries)Middle incomeMoldovaMontenegroMoroccoMozambiqueMyanmarNetherlandsNew CaledoniaNew ZealandNicaraguaNigerNigeriaNorth AmericaNorwayOECD membersOmanOther small statesPacific island small statesPakistanPanamaPapua New GuineaParaguayPeruPhilippinesPolandPortugalPost-demographic dividendPre-demographic dividendQatarRomaniaRussian FederationRwandaSaudi ArabiaSenegalSerbiaSeychellesSierra LeoneSingaporeSlovak RepublicSloveniaSmall statesSomaliaSouth AfricaSouth AsiaSouth Asia (IDA & IBRD)SpainSri LankaSt. LuciaSt. Vincent and the GrenadinesSub-Saharan Africa Sub-Saharan Africa (excluding high income)Sub-Saharan Africa (IDA & IBRD countries)SudanSurinameSwedenSwitzerlandSyrian Arab RepublicTanzaniaThailandTogoTrinidad and TobagoTunisiaTurkeyUgandaUkraineUnited Arab EmiratesUnited KingdomUnited StatesUpper middle incomeUruguayVenezuela, RBVietnamWorldYemen, Rep.ZambiaZimbabwe línea de tiempo (timeline):
En esta escala de tiempo se presenta un gráfico de 1961 y 2015 de Tanzania. Los datos de 1960 están ausentes. El número de observaciones reales por fecha: 55.
Fuente (nombre):
Indicadores del desarrollo mundial
Fuente (organización):
World Bank staff estimates based data from International Monetary Fund's Direction of Trade database.
Categorías:
Private Sector, Trade
Se ha actualizado:
23 abr 2017 año
Los indicadores de los cambios de valor en los últimos años
Mínimo:
0.33
1 ene 1968 año
Máximo:
27.191
1 ene 2005 año
A la fecha de observación
Valor
Cambio absoluto
El cambio con respecto al valor anterior
1 ene 1961 año
3.265
+3.265
0.0%
1 ene 1962 año
2.088
-1.177
-36.04%
1 ene 1963 año
2.143
+0.055
2.62%
1 ene 1964 año
0.71
-1.433
-66.86%
1 ene 1965 año
0.572
-0.138
-19.39%
1 ene 1966 año
1.291
+0.719
125.6%
1 ene 1967 año
0.556
-0.735
-56.9%
1 ene 1968 año
0.33
-0.227
-40.73%
1 ene 1969 año
16.788
+16.458
4.99 mil%
1 ene 1970 año
15.568
-1.22
-7.27%
1 ene 1971 año
15.064
-0.504
-3.24%
1 ene 1972 año
11.96
-3.104
-20.6%
1 ene 1973 año
11.358
-0.602
-5.03%
1 ene 1974 año
10.478
-0.88
-7.75%
1 ene 1975 año
7.887
-2.591
-24.73%
1 ene 1976 año
7.312
-0.575
-7.29%
1 ene 1977 año
12.743
+5.431
74.28%
1 ene 1978 año
3.686
-9.057
-71.08%
1 ene 1979 año
1.083
-2.603
-70.62%
1 ene 1980 año
2.11
+1.027
94.86%
1 ene 1981 año
1.503
-0.607
-28.77%
1 ene 1982 año
2.074
+0.571
37.98%
1 ene 1983 año
4.52
+2.446
117.92%
1 ene 1984 año
4.987
+0.467
10.33%
1 ene 1985 año
4.82
-0.166
-3.34%
1 ene 1986 año
3.693
-1.128
-23.4%
1 ene 1987 año
5.131
+1.439
38.96%
1 ene 1988 año
4.589
-0.543
-10.57%
1 ene 1989 año
0.389
-4.2
-91.53%
1 ene 1990 año
3.792
+3.403
875.06%
1 ene 1991 año
3.593
-0.199
-5.25%
1 ene 1992 año
5.084
+1.491
41.51%
1 ene 1993 año
4.883
-0.201
-3.95%
1 ene 1994 año
9.578
+4.695
96.15%
1 ene 1995 año
19.152
+9.573
99.95%
1 ene 1996 año
25.786
+6.634
34.64%
1 ene 1997 año
25.476
-0.31
-1.2%
1 ene 1998 año
16.318
-9.158
-35.95%
1 ene 1999 año
18.597
+2.279
13.97%
1 ene 2000 año
18.829
+0.232
1.25%
1 ene 2001 año
20.156
+1.326
7.04%
1 ene 2002 año
19.301
-0.854
-4.24%
1 ene 2003 año
18.104
-1.197
-6.2%
1 ene 2004 año
27.017
+8.913
49.23%
1 ene 2005 año
27.191
+0.174
0.65%
1 ene 2006 año
23.175
-4.016
-14.77%
1 ene 2007 año
19.255
-3.92
-16.92%
1 ene 2008 año
17.723
-1.533
-7.96%
1 ene 2009 año
15.563
-2.159
-12.18%
1 ene 2010 año
15.954
+0.39
2.51%
1 ene 2011 año
15.197
-0.757
-4.74%
1 ene 2012 año
12.324
-2.873
-18.91%
1 ene 2013 año
13.198
+0.875
7.1%
1 ene 2014 año
9.149
-4.05
-30.68%
1 ene 2015 año
8.284
-0.865
-9.46%
Ranking de los países por los datos estadísticos actuales


Comentarios: