29
/es/
es
AIzaSyAYiBZKx7MnpbEhh9jyipgxe19OcubqV5w
April 1, 2024
24302
Arab World
ARB
false
2
1
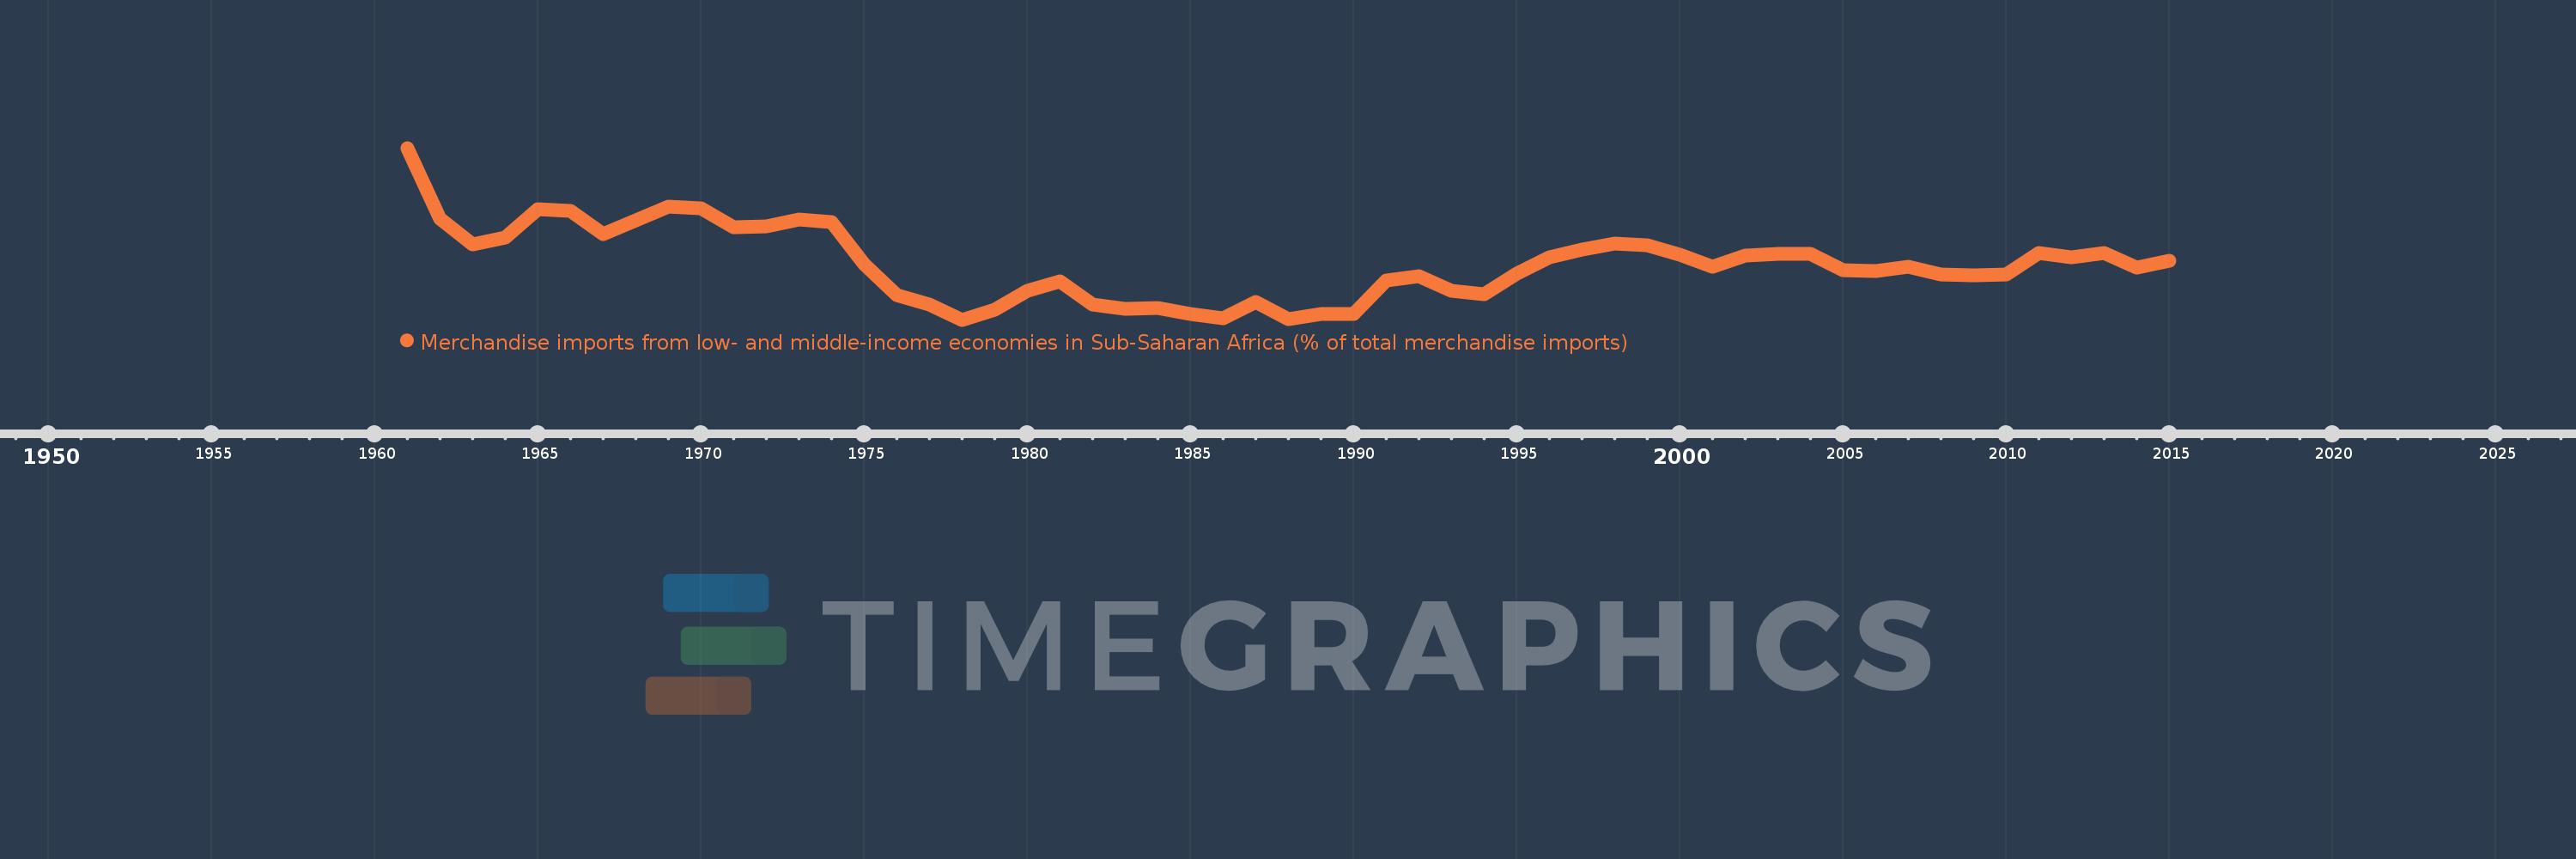
Merchandise imports from low- and middle-income economies in Sub-Saharan Africa (% of total merchandise imports)
2015,2014,2013,2012,2011,2010,2009,2008,2007,2006,2005,2004,2003,2002,2001,2000,1999,1998,1997,1996,1995,1994,1993,1992,1991,1990,1989,1988,1987,1986,1985,1984,1983,1982,1981,1980,1979,1978,1977,1976,1975,1974,1973,1972,1971,1970,1969,1968,1967,1966,1965,1964,1963,1962,1961
Estas estadísticas en otros países:
AlbaniaAlgeriaAngolaArab WorldArgentinaArmeniaArubaAustraliaAustriaAzerbaijanBahamas, TheBahrainBangladeshBarbadosBelarusBelgiumBelizeBeninBermudaBoliviaBrazilBrunei DarussalamBulgariaBurkina FasoBurundiCabo VerdeCambodiaCameroonCanadaCaribbean small statesCentral African RepublicCentral Europe and the BalticsChadChileChinaColombiaCongo, Dem. Rep.Congo, Rep.Costa RicaCote d'IvoireCroatiaCubaCyprusCzech RepublicDenmarkDjiboutiDominicaDominican RepublicEarly-demographic dividendEast Asia & PacificEast Asia & Pacific (excluding high income)East Asia & Pacific (IDA & IBRD countries)EcuadorEgypt, Arab Rep.El SalvadorEstoniaEthiopiaEuro areaEurope & Central AsiaEurope & Central Asia (excluding high income)Europe & Central Asia (IDA & IBRD countries)European UnionFijiFinlandFragile and conflict affected situationsFranceGabonGambia, TheGeorgiaGermanyGhanaGreeceGreenlandGrenadaGuatemalaGuineaGuinea-BissauGuyanaHaitiHeavily indebted poor countries (HIPC)High incomeHondurasHong Kong SAR, ChinaHungaryIBRD onlyIcelandIDA & IBRD totalIDA blendIDA onlyIDA totalIndiaIndonesiaIran, Islamic Rep.IraqIrelandIsraelItalyJamaicaJapanJordanKazakhstanKenyaKorea, Dem. People’s Rep.Korea, Rep.KuwaitLao PDRLate-demographic dividendLatin America & Caribbean Latin America & Caribbean (excluding high income)Latin America & the Caribbean (IDA & IBRD countries)LatviaLeast developed countries: UN classificationLebanonLiberiaLibyaLithuaniaLow & middle incomeLow incomeLower middle incomeLuxembourgMacao SAR, ChinaMacedonia, FYRMadagascarMalawiMalaysiaMaliMaltaMauritaniaMauritiusMexicoMiddle East & North AfricaMiddle East & North Africa (excluding high income)Middle East & North Africa (IDA & IBRD countries)Middle incomeMoldovaMontenegroMoroccoMozambiqueMyanmarNetherlandsNew CaledoniaNew ZealandNicaraguaNigerNigeriaNorth AmericaNorwayOECD membersOmanOther small statesPacific island small statesPakistanPanamaPapua New GuineaParaguayPeruPhilippinesPolandPortugalPost-demographic dividendPre-demographic dividendQatarRomaniaRussian FederationRwandaSaudi ArabiaSenegalSerbiaSeychellesSierra LeoneSingaporeSlovak RepublicSloveniaSmall statesSomaliaSouth AfricaSouth AsiaSouth Asia (IDA & IBRD)SpainSri LankaSt. LuciaSt. Vincent and the GrenadinesSub-Saharan Africa Sub-Saharan Africa (excluding high income)Sub-Saharan Africa (IDA & IBRD countries)SudanSurinameSwedenSwitzerlandSyrian Arab RepublicTanzaniaThailandTogoTrinidad and TobagoTunisiaTurkeyUgandaUkraineUnited Arab EmiratesUnited KingdomUnited StatesUpper middle incomeUruguayVenezuela, RBVietnamWorldYemen, Rep.ZambiaZimbabwe línea de tiempo (timeline):
En esta escala de tiempo se presenta un gráfico de 1961 y 2015 de Arab World. Los datos de 1960 están ausentes. El número de observaciones reales por fecha: 55.
Fuente (nombre):
Indicadores del desarrollo mundial
Fuente (organización):
World Bank staff estimates based data from International Monetary Fund's Direction of Trade database.
Categorías:
Private Sector, Trade
Se ha actualizado:
23 abr 2017 año
Los indicadores de los cambios de valor en los últimos años
Mínimo:
0.54
1 ene 1978 año
Máximo:
2.39
1 ene 1961 año
A la fecha de observación
Valor
Cambio absoluto
El cambio con respecto al valor anterior
1 ene 1961 año
2.39
+2.39
0.0%
1 ene 1962 año
1.631
-0.759
-31.75%
1 ene 1963 año
1.35
-0.281
-17.25%
1 ene 1964 año
1.428
+0.078
5.75%
1 ene 1965 año
1.733
+0.305
21.36%
1 ene 1966 año
1.71
-0.022
-1.3%
1 ene 1967 año
1.46
-0.25
-14.65%
1 ene 1968 año
1.607
+0.148
10.12%
1 ene 1969 año
1.757
+0.15
9.31%
1 ene 1970 año
1.744
-0.013
-0.72%
1 ene 1971 año
1.532
-0.212
-12.17%
1 ene 1972 año
1.55
+0.018
1.15%
1 ene 1973 año
1.618
+0.068
4.41%
1 ene 1974 año
1.595
-0.022
-1.39%
1 ene 1975 año
1.143
-0.453
-28.37%
1 ene 1976 año
0.809
-0.334
-29.21%
1 ene 1977 año
0.702
-0.107
-13.23%
1 ene 1978 año
0.54
-0.162
-23.13%
1 ene 1979 año
0.648
+0.108
20.04%
1 ene 1980 año
0.855
+0.207
31.96%
1 ene 1981 año
0.949
+0.095
11.06%
1 ene 1982 año
0.703
-0.246
-25.89%
1 ene 1983 año
0.655
-0.048
-6.86%
1 ene 1984 año
0.67
+0.015
2.25%
1 ene 1985 año
0.604
-0.066
-9.82%
1 ene 1986 año
0.559
-0.045
-7.52%
1 ene 1987 año
0.729
+0.17
30.48%
1 ene 1988 año
0.548
-0.181
-24.85%
1 ene 1989 año
0.598
+0.05
9.17%
1 ene 1990 año
0.606
+0.008
1.31%
1 ene 1991 año
0.964
+0.358
59.13%
1 ene 1992 año
1.009
+0.045
4.65%
1 ene 1993 año
0.856
-0.153
-15.17%
1 ene 1994 año
0.812
-0.044
-5.16%
1 ene 1995 año
1.034
+0.222
27.32%
1 ene 1996 año
1.21
+0.177
17.09%
1 ene 1997 año
1.293
+0.083
6.82%
1 ene 1998 año
1.356
+0.063
4.9%
1 ene 1999 año
1.341
-0.015
-1.12%
1 ene 2000 año
1.239
-0.102
-7.58%
1 ene 2001 año
1.11
-0.129
-10.41%
1 ene 2002 año
1.231
+0.12
10.83%
1 ene 2003 año
1.25
+0.019
1.55%
1 ene 2004 año
1.247
-0.003
-0.22%
1 ene 2005 año
1.071
-0.176
-14.12%
1 ene 2006 año
1.065
-0.006
-0.54%
1 ene 2007 año
1.109
+0.044
4.1%
1 ene 2008 año
1.025
-0.084
-7.59%
1 ene 2009 año
1.014
-0.011
-1.08%
1 ene 2010 año
1.029
+0.015
1.51%
1 ene 2011 año
1.258
+0.229
22.29%
1 ene 2012 año
1.211
-0.047
-3.72%
1 ene 2013 año
1.263
+0.052
4.27%
1 ene 2014 año
1.097
-0.166
-13.15%
1 ene 2015 año
1.172
+0.075
6.81%
Ranking de los países por los datos estadísticos actuales


Comentarios: