29
/es/
es
AIzaSyAYiBZKx7MnpbEhh9jyipgxe19OcubqV5w
April 1, 2024
32832
Europe & Central Asia (IDA & IBRD countries)
TEC
false
2
1
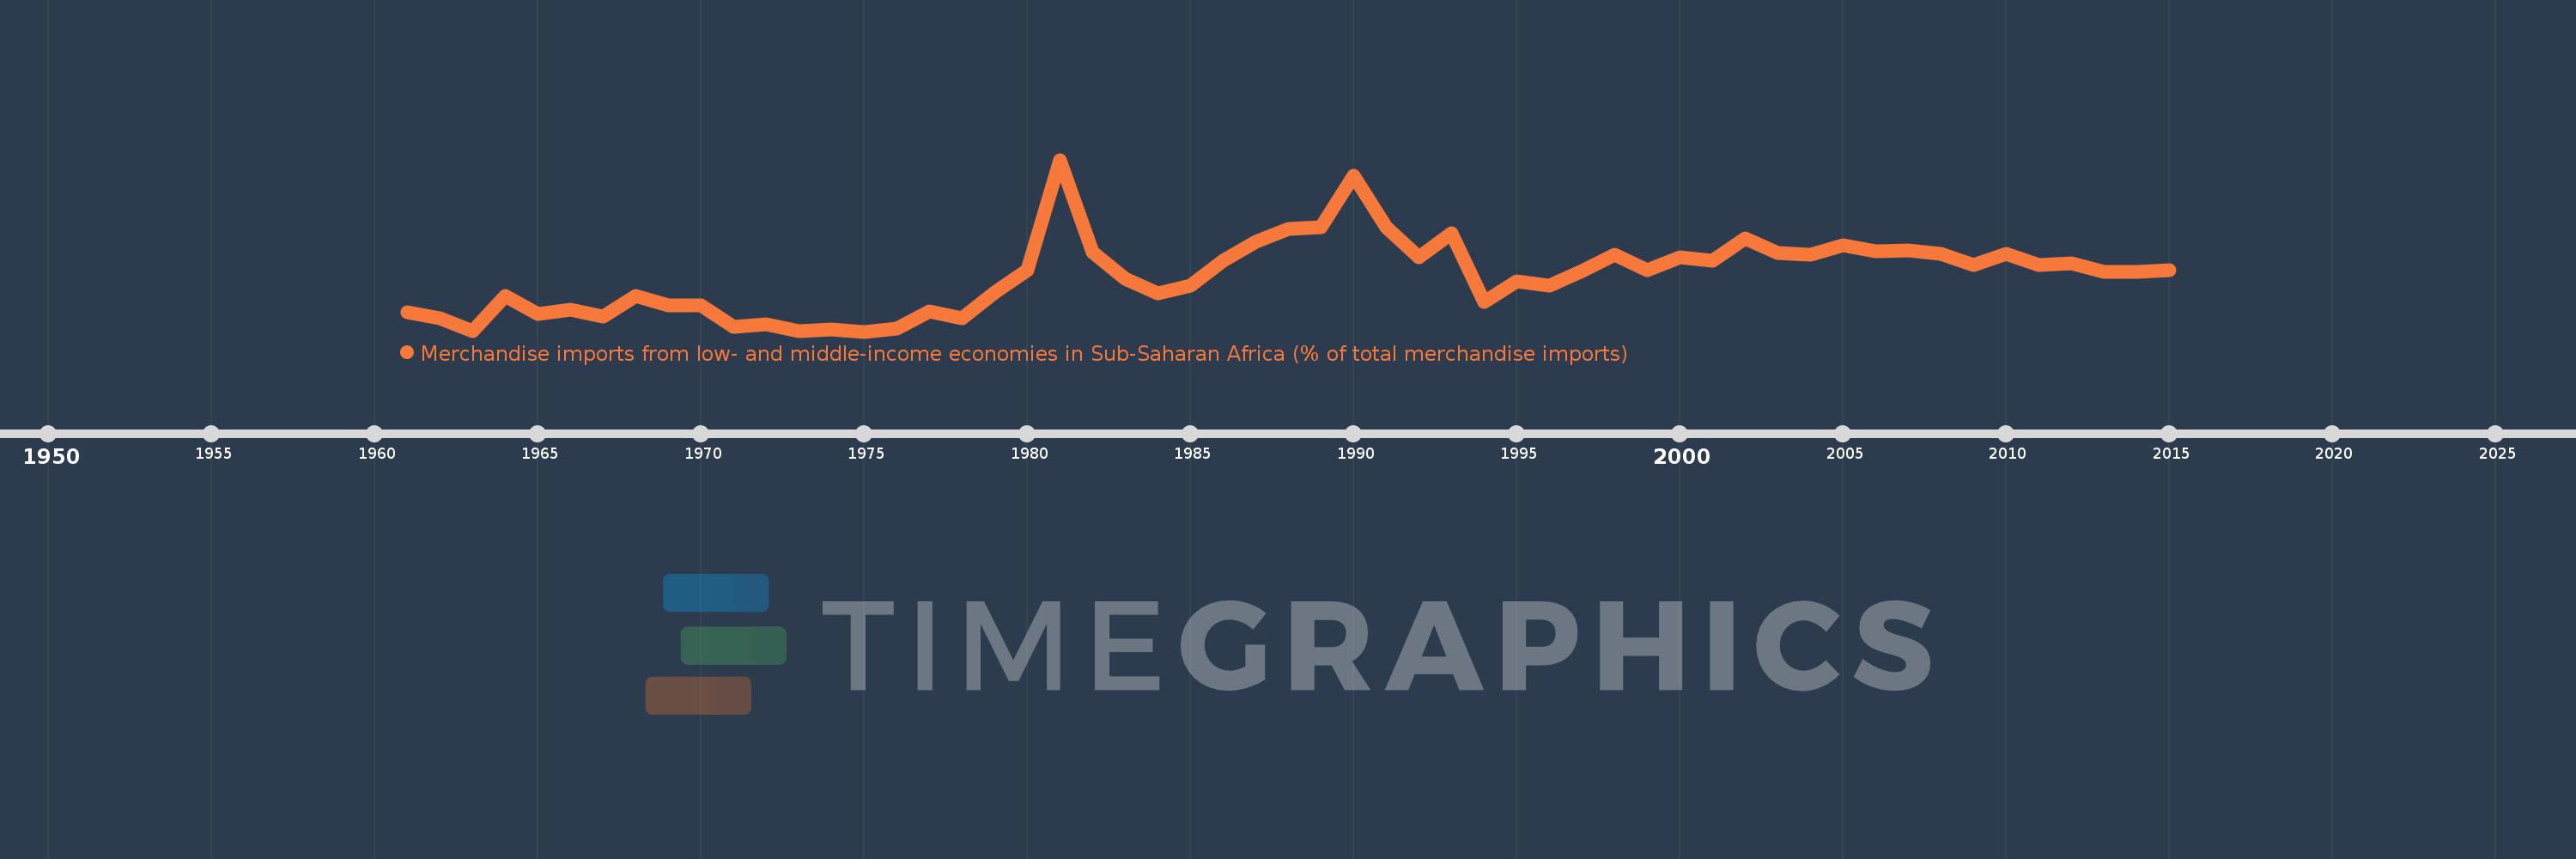
Merchandise imports from low- and middle-income economies in Sub-Saharan Africa (% of total merchandise imports)
2015,2014,2013,2012,2011,2010,2009,2008,2007,2006,2005,2004,2003,2002,2001,2000,1999,1998,1997,1996,1995,1994,1993,1992,1991,1990,1989,1988,1987,1986,1985,1984,1983,1982,1981,1980,1979,1978,1977,1976,1975,1974,1973,1972,1971,1970,1969,1968,1967,1966,1965,1964,1963,1962,1961
Estas estadísticas en otros países:
AlbaniaAlgeriaAngolaArab WorldArgentinaArmeniaArubaAustraliaAustriaAzerbaijanBahamas, TheBahrainBangladeshBarbadosBelarusBelgiumBelizeBeninBermudaBoliviaBrazilBrunei DarussalamBulgariaBurkina FasoBurundiCabo VerdeCambodiaCameroonCanadaCaribbean small statesCentral African RepublicCentral Europe and the BalticsChadChileChinaColombiaCongo, Dem. Rep.Congo, Rep.Costa RicaCote d'IvoireCroatiaCubaCyprusCzech RepublicDenmarkDjiboutiDominicaDominican RepublicEarly-demographic dividendEast Asia & PacificEast Asia & Pacific (excluding high income)East Asia & Pacific (IDA & IBRD countries)EcuadorEgypt, Arab Rep.El SalvadorEstoniaEthiopiaEuro areaEurope & Central AsiaEurope & Central Asia (excluding high income)Europe & Central Asia (IDA & IBRD countries)European UnionFijiFinlandFragile and conflict affected situationsFranceGabonGambia, TheGeorgiaGermanyGhanaGreeceGreenlandGrenadaGuatemalaGuineaGuinea-BissauGuyanaHaitiHeavily indebted poor countries (HIPC)High incomeHondurasHong Kong SAR, ChinaHungaryIBRD onlyIcelandIDA & IBRD totalIDA blendIDA onlyIDA totalIndiaIndonesiaIran, Islamic Rep.IraqIrelandIsraelItalyJamaicaJapanJordanKazakhstanKenyaKorea, Dem. People’s Rep.Korea, Rep.KuwaitLao PDRLate-demographic dividendLatin America & Caribbean Latin America & Caribbean (excluding high income)Latin America & the Caribbean (IDA & IBRD countries)LatviaLeast developed countries: UN classificationLebanonLiberiaLibyaLithuaniaLow & middle incomeLow incomeLower middle incomeLuxembourgMacao SAR, ChinaMacedonia, FYRMadagascarMalawiMalaysiaMaliMaltaMauritaniaMauritiusMexicoMiddle East & North AfricaMiddle East & North Africa (excluding high income)Middle East & North Africa (IDA & IBRD countries)Middle incomeMoldovaMontenegroMoroccoMozambiqueMyanmarNetherlandsNew CaledoniaNew ZealandNicaraguaNigerNigeriaNorth AmericaNorwayOECD membersOmanOther small statesPacific island small statesPakistanPanamaPapua New GuineaParaguayPeruPhilippinesPolandPortugalPost-demographic dividendPre-demographic dividendQatarRomaniaRussian FederationRwandaSaudi ArabiaSenegalSerbiaSeychellesSierra LeoneSingaporeSlovak RepublicSloveniaSmall statesSomaliaSouth AfricaSouth AsiaSouth Asia (IDA & IBRD)SpainSri LankaSt. LuciaSt. Vincent and the GrenadinesSub-Saharan Africa Sub-Saharan Africa (excluding high income)Sub-Saharan Africa (IDA & IBRD countries)SudanSurinameSwedenSwitzerlandSyrian Arab RepublicTanzaniaThailandTogoTrinidad and TobagoTunisiaTurkeyUgandaUkraineUnited Arab EmiratesUnited KingdomUnited StatesUpper middle incomeUruguayVenezuela, RBVietnamWorldYemen, Rep.ZambiaZimbabwe línea de tiempo (timeline):
En esta escala de tiempo se presenta un gráfico de 1961 y 2015 de Europe & Central Asia (IDA & IBRD countries). Los datos de 1960 están ausentes. El número de observaciones reales por fecha: 55.
Fuente (nombre):
Indicadores del desarrollo mundial
Fuente (organización):
World Bank staff estimates based data from International Monetary Fund's Direction of Trade database.
Categorías:
Private Sector, Trade
Se ha actualizado:
23 abr 2017 año
Los indicadores de los cambios de valor en los últimos años
Mínimo:
0.028
1 ene 1975 año
Máximo:
1.521
1 ene 1981 año
A la fecha de observación
Valor
Cambio absoluto
El cambio con respecto al valor anterior
1 ene 1961 año
0.193
+0.193
0.0%
1 ene 1962 año
0.145
-0.048
-24.9%
1 ene 1963 año
0.03
-0.115
-79.21%
1 ene 1964 año
0.335
+0.305
1.01 mil%
1 ene 1965 año
0.183
-0.152
-45.42%
1 ene 1966 año
0.217
+0.034
18.65%
1 ene 1967 año
0.162
-0.055
-25.33%
1 ene 1968 año
0.339
+0.177
109.04%
1 ene 1969 año
0.258
-0.081
-23.85%
1 ene 1970 año
0.256
-0.002
-0.69%
1 ene 1971 año
0.072
-0.185
-71.98%
1 ene 1972 año
0.095
+0.023
32.05%
1 ene 1973 año
0.032
-0.063
-66.01%
1 ene 1974 año
0.049
+0.017
52.42%
1 ene 1975 año
0.028
-0.021
-42.96%
1 ene 1976 año
0.051
+0.023
83.11%
1 ene 1977 año
0.207
+0.156
303.68%
1 ene 1978 año
0.146
-0.061
-29.39%
1 ene 1979 año
0.365
+0.219
149.39%
1 ene 1980 año
0.564
+0.199
54.49%
1 ene 1981 año
1.521
+0.957
169.71%
1 ene 1982 año
0.72
-0.801
-52.69%
1 ene 1983 año
0.485
-0.235
-32.6%
1 ene 1984 año
0.359
-0.126
-26.04%
1 ene 1985 año
0.43
+0.071
19.78%
1 ene 1986 año
0.641
+0.211
49.2%
1 ene 1987 año
0.808
+0.167
26.12%
1 ene 1988 año
0.923
+0.115
14.19%
1 ene 1989 año
0.933
+0.01
1.07%
1 ene 1990 año
1.381
+0.448
48.04%
1 ene 1991 año
0.933
-0.448
-32.42%
1 ene 1992 año
0.67
-0.264
-28.27%
1 ene 1993 año
0.882
+0.213
31.74%
1 ene 1994 año
0.286
-0.596
-67.62%
1 ene 1995 año
0.467
+0.181
63.54%
1 ene 1996 año
0.431
-0.036
-7.77%
1 ene 1997 año
0.552
+0.121
28.11%
1 ene 1998 año
0.693
+0.141
25.6%
1 ene 1999 año
0.565
-0.128
-18.49%
1 ene 2000 año
0.677
+0.112
19.84%
1 ene 2001 año
0.642
-0.035
-5.22%
1 ene 2002 año
0.84
+0.198
30.86%
1 ene 2003 año
0.708
-0.132
-15.67%
1 ene 2004 año
0.696
-0.013
-1.79%
1 ene 2005 año
0.779
+0.084
12.01%
1 ene 2006 año
0.725
-0.055
-7.02%
1 ene 2007 año
0.731
+0.006
0.86%
1 ene 2008 año
0.7
-0.031
-4.21%
1 ene 2009 año
0.61
-0.09
-12.9%
1 ene 2010 año
0.7
+0.09
14.79%
1 ene 2011 año
0.604
-0.096
-13.68%
1 ene 2012 año
0.623
+0.019
3.08%
1 ene 2013 año
0.549
-0.074
-11.88%
1 ene 2014 año
0.544
-0.005
-0.83%
1 ene 2015 año
0.565
+0.021
3.87%
Ranking de los países por los datos estadísticos actuales


Comentarios: