33
/
AIzaSyB4mHJ5NPEv-XzF7P6NDYXjlkCWaeKw5bc
November 30, 2025
94034
Bulgaria
BGR
true
2
1
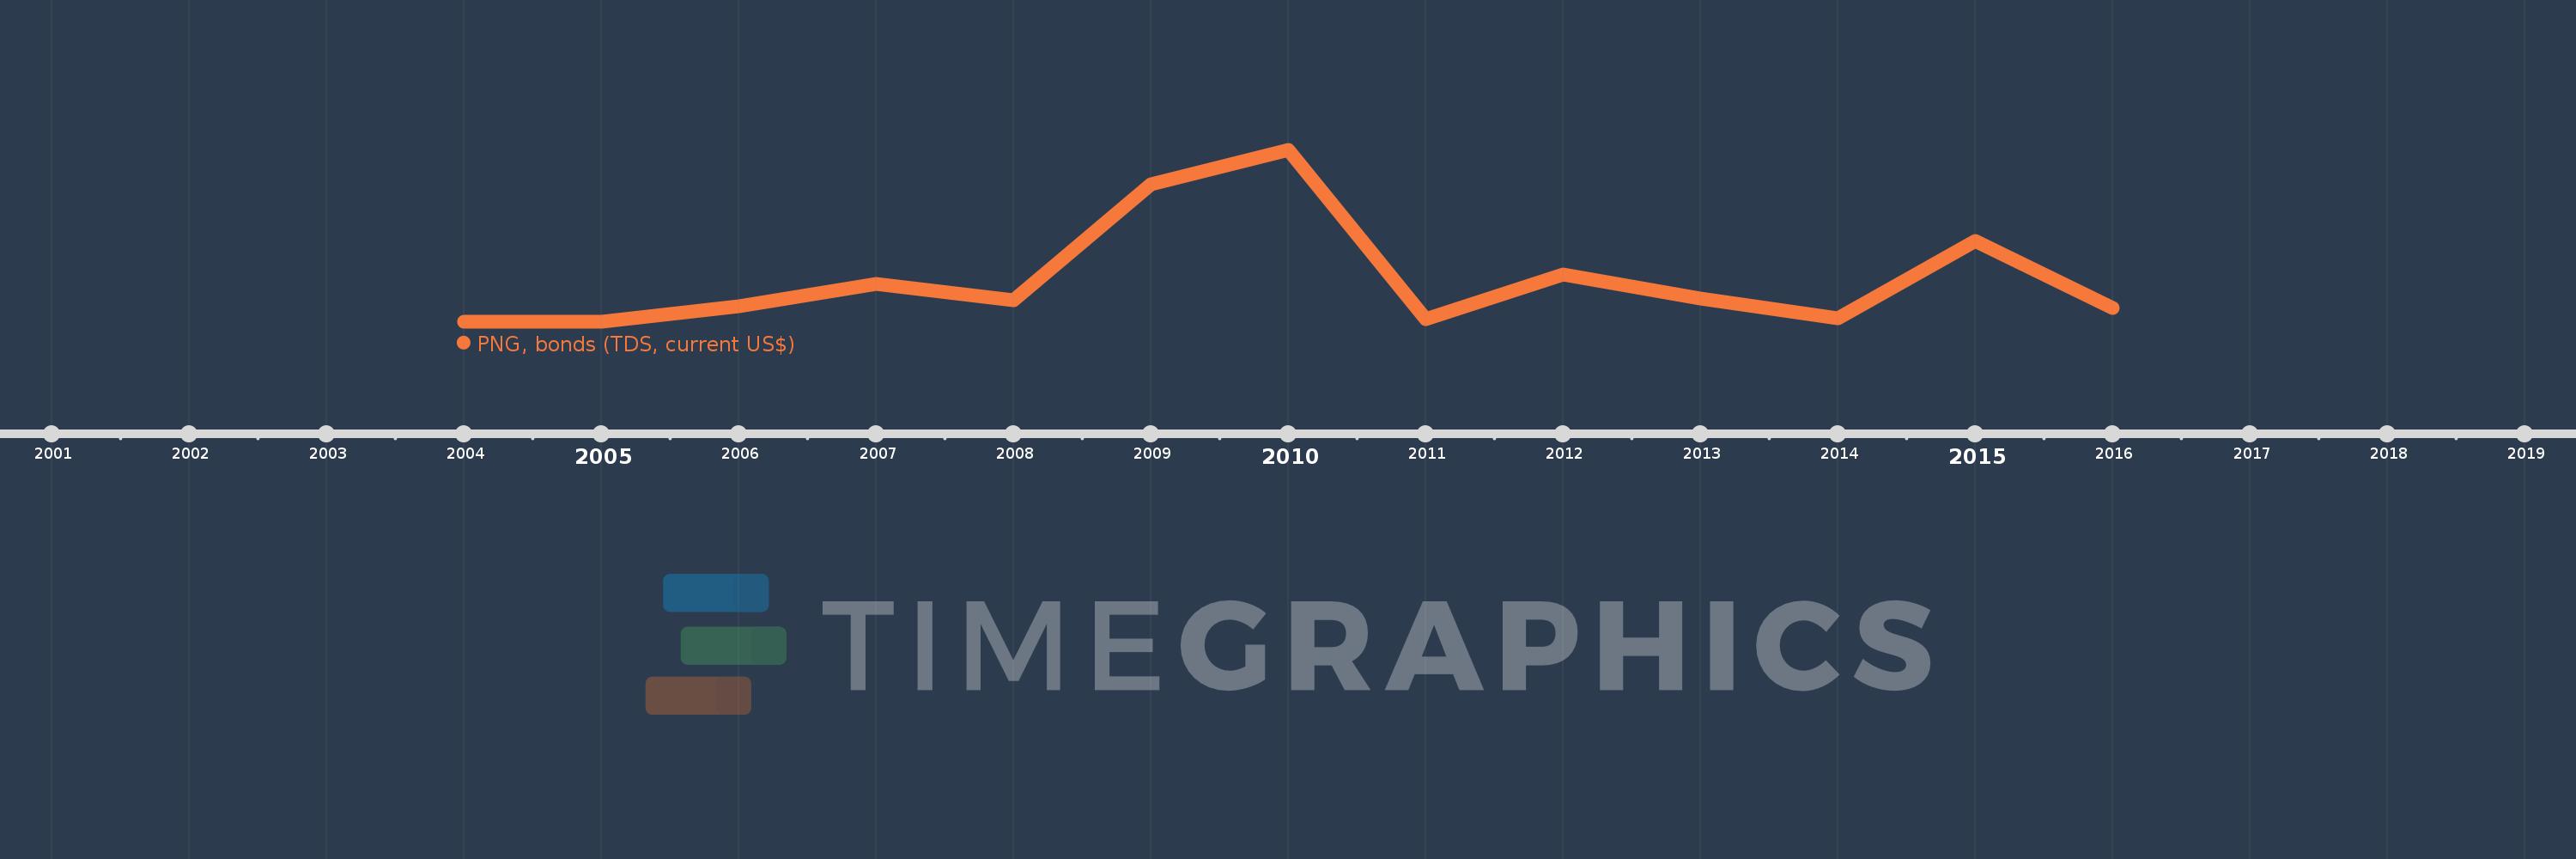
PNG, bonds (TDS, current US$)
2016,2015,2014,2013,2012,2011,2010,2009,2008,2007,2006,2005,2004
Create a timeline
Public Timelines
For education
For educational institutions
For teachers
For students
Cabinet
For educational institutions
For teachers
For students
Open cabinet
FAQ
Close
Create a timeline
Public timelines
FAQ
About & Feedback
Terms
Privacy
FAQ
Support 24/7
Cabinet
Get premium
Donate
Download
Global statistics library
→
Bulgaria
→
PNG, bonds (TDS, current US$)
This statistics in other country:
Argentina
Botswana
Brazil
Bulgaria
China
Colombia
Costa Rica
Dominican Republic
East Asia & Pacific (excluding high income)
Ecuador
Egypt, Arab Rep.
El Salvador
Europe & Central Asia (excluding high income)
Georgia
Ghana
Guatemala
IDA only
India
Indonesia
Jamaica
Kazakhstan
Lao PDR
Latin America & Caribbean (excluding high income)
Lebanon
Low & middle income
Lower middle income
Malaysia
Mexico
Middle East & North Africa (excluding high income)
Middle income
Mongolia
Nigeria
Pakistan
Panama
Paraguay
Peru
Philippines
Romania
Russian Federation
Serbia
South Africa
South Asia
Sri Lanka
Sub-Saharan Africa (excluding high income)
Thailand
Turkey
Ukraine
Upper middle income
Venezuela, RB
Vietnam
Timeline:
This timeline shows a graph from
2004
to
2016
of Bulgaria. No data until
2003
. Number of actual observations by date:
13
.
Source name:
World Development Indicators
Source organization:
World Bank, International Debt Statistics.
Categories, topics:
External Debt
Last updated:
apr 23, 2017
Indicators value changes by year
Meaning:
103.487 mln
Minimum:
4.195 mln
jan 1, 2004
Maximum:
401.508 mln
jan 1, 2010
At the date of observation
Value
Absolute change
Change from the previous value
jan 1, 2004
4.195 mln
+4.195 mln
0.0%
jan 1, 2005
4.514 mln
+319.0K
7.6%
jan 1, 2006
40.149 mln
+35.635 mln
789.43%
jan 1, 2007
93.143 mln
+52.994 mln
131.99%
jan 1, 2008
55.179 mln
-37.964 mln
-40.76%
jan 1, 2009
323.112 mln
+267.933 mln
485.57%
jan 1, 2010
401.508 mln
+78.396 mln
24.26%
jan 1, 2011
11.111 mln
-390.397 mln
-97.23%
jan 1, 2012
114.967 mln
+103.856 mln
934.71%
jan 1, 2013
57.478 mln
-57.489 mln
-50.0%
jan 1, 2014
12.374 mln
-45.104 mln
-78.47%
jan 1, 2015
191.895 mln
+179.521 mln
1.45K%
jan 1, 2016
35.708 mln
-156.187 mln
-81.39%
Ranking of countries by current statistics by years
About & Feedback
Terms
Privacy
FAQ
Support 24/7
Cabinet
Get premium
Donate
The service accepts bank transfer (ACH, Wire) or cards (Visa, MasterCard, etc). Processed by Stripe.
Secured with SSL