33
/
AIzaSyB4mHJ5NPEv-XzF7P6NDYXjlkCWaeKw5bc
November 30, 2025
107761
Colombia
COL
true
2
1
PNG, bonds (TDS, current US$)
2016,2015,2014,2013,2012,2011,2010,2009,2008,2007,2006,2005,2004,2003,2002,2001,2000,1999,1998,1997,1996
Create a timeline
Public Timelines
For education
For educational institutions
For teachers
For students
Cabinet
For educational institutions
For teachers
For students
Open cabinet
FAQ
Close
Create a timeline
Public timelines
FAQ
About & Feedback
Terms
Privacy
FAQ
Support 24/7
Cabinet
Get premium
Donate
Download
Global statistics library
→
Colombia
→
PNG, bonds (TDS, current US$)
This statistics in other country:
Argentina
Botswana
Brazil
Bulgaria
China
Colombia
Costa Rica
Dominican Republic
East Asia & Pacific (excluding high income)
Ecuador
Egypt, Arab Rep.
El Salvador
Europe & Central Asia (excluding high income)
Georgia
Ghana
Guatemala
IDA only
India
Indonesia
Jamaica
Kazakhstan
Lao PDR
Latin America & Caribbean (excluding high income)
Lebanon
Low & middle income
Lower middle income
Malaysia
Mexico
Middle East & North Africa (excluding high income)
Middle income
Mongolia
Nigeria
Pakistan
Panama
Paraguay
Peru
Philippines
Romania
Russian Federation
Serbia
South Africa
South Asia
Sri Lanka
Sub-Saharan Africa (excluding high income)
Thailand
Turkey
Ukraine
Upper middle income
Venezuela, RB
Vietnam
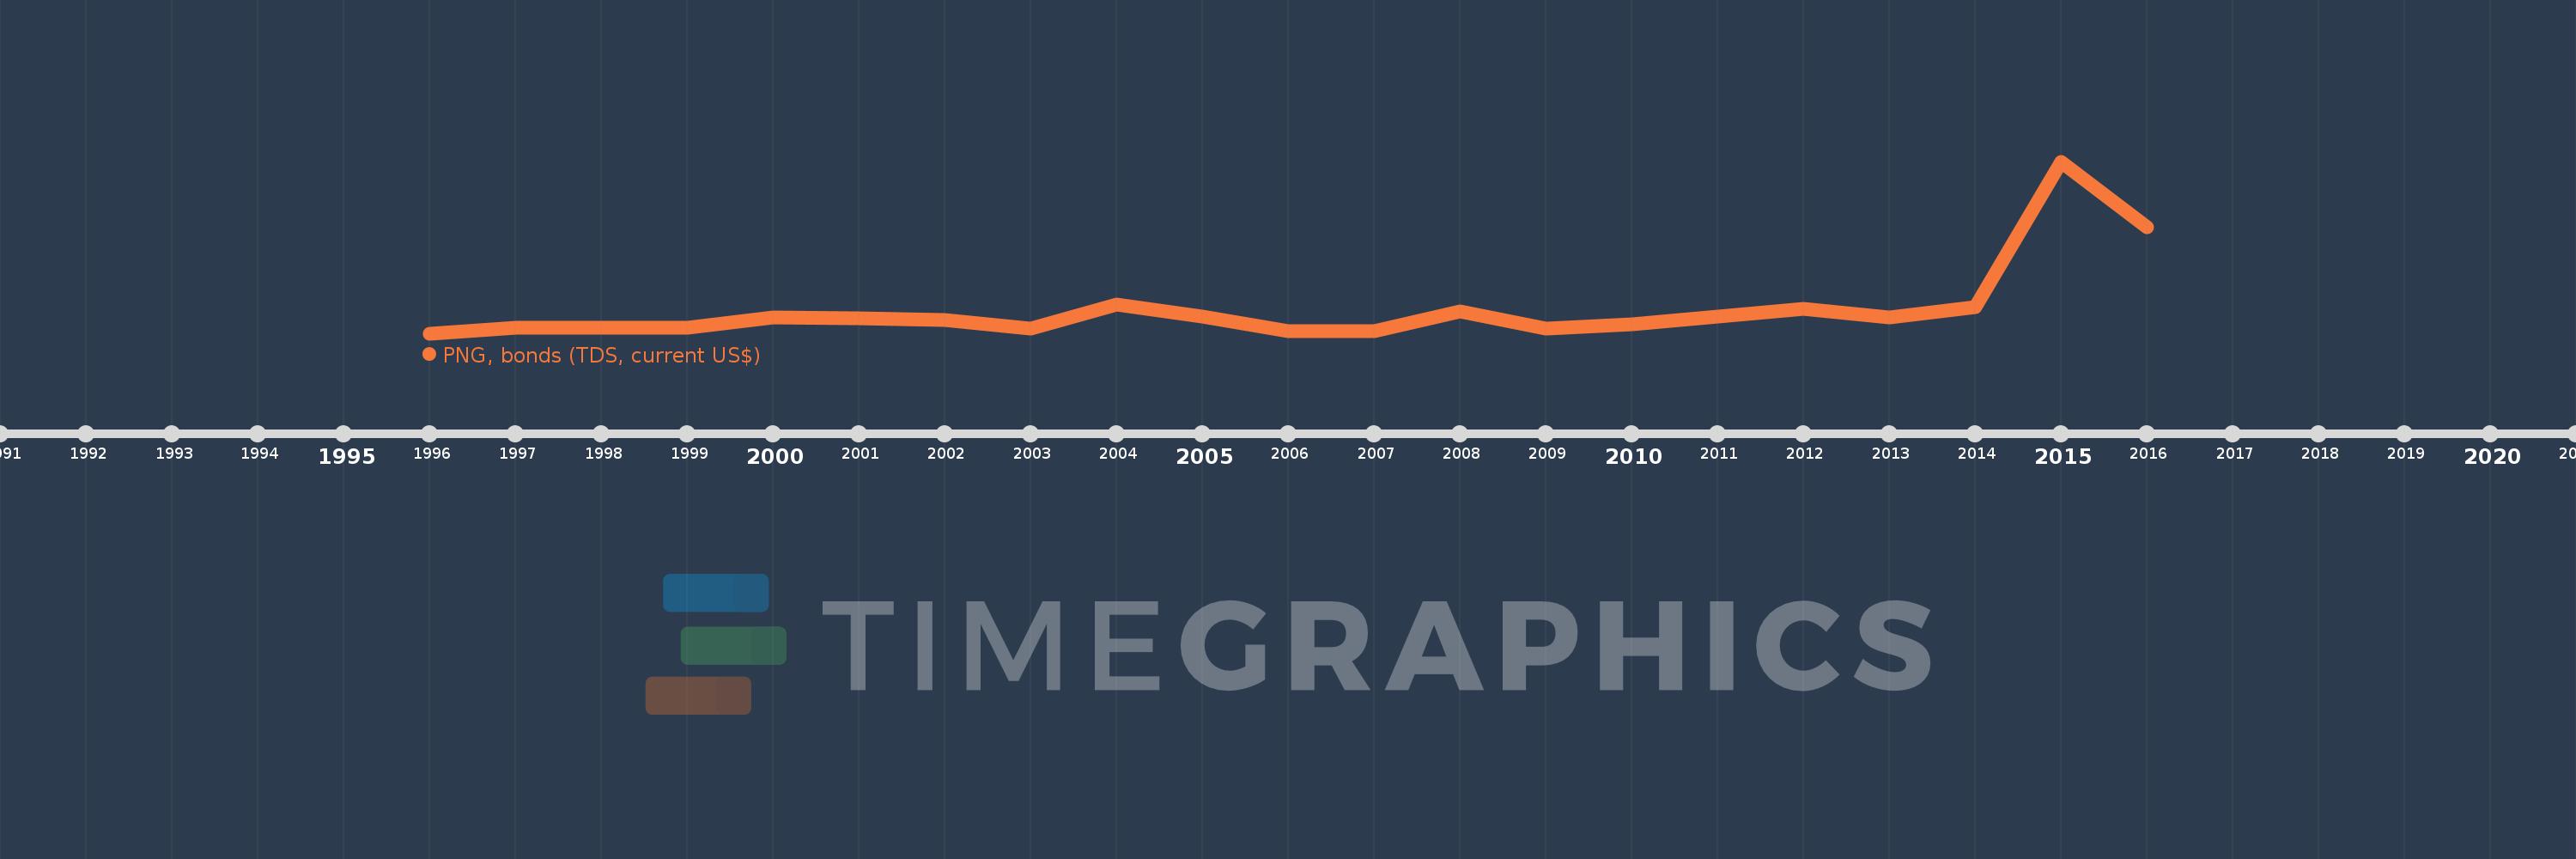
Timeline:
This timeline shows a graph from
1996
to
2016
of Colombia. No data until
1995
. Number of actual observations by date:
21
.
Source name:
World Development Indicators
Source organization:
World Bank, International Debt Statistics.
Categories, topics:
External Debt
Last updated:
apr 23, 2017
Indicators value changes by year
Meaning:
308.253 mln
Minimum:
15.034 mln
jan 1, 1996
Maximum:
2.086 bln
jan 1, 2015
At the date of observation
Value
Absolute change
Change from the previous value
jan 1, 1996
15.034 mln
+15.034 mln
0.0%
jan 1, 1997
78.0 mln
+62.966 mln
418.82%
jan 1, 1998
81.806 mln
+3.806 mln
4.88%
jan 1, 1999
81.582 mln
-224.0K
-0.27%
jan 1, 2000
207.215 mln
+125.633 mln
154.0%
jan 1, 2001
194.161 mln
-13.054 mln
-6.3%
jan 1, 2002
177.209 mln
-16.952 mln
-8.73%
jan 1, 2003
75.166 mln
-102.043 mln
-57.58%
jan 1, 2004
357.096 mln
+281.93 mln
375.08%
jan 1, 2005
213.762 mln
-143.334 mln
-40.14%
jan 1, 2006
35.894 mln
-177.868 mln
-83.21%
jan 1, 2007
42.694 mln
+6.8 mln
18.94%
jan 1, 2008
275.054 mln
+232.36 mln
544.25%
jan 1, 2009
68.096 mln
-206.958 mln
-75.24%
jan 1, 2010
128.906 mln
+60.81 mln
89.3%
jan 1, 2011
221.092 mln
+92.186 mln
71.51%
jan 1, 2012
308.416 mln
+87.324 mln
39.5%
jan 1, 2013
202.263 mln
-106.153 mln
-34.42%
jan 1, 2014
333.449 mln
+131.186 mln
64.86%
jan 1, 2015
2.086 bln
+1.753 bln
525.68%
jan 1, 2016
1.29 bln
-796.226 mln
-38.16%
Ranking of countries by current statistics by years
About & Feedback
Terms
Privacy
FAQ
Support 24/7
Cabinet
Get premium
Donate
The service accepts bank transfer (ACH, Wire) or cards (Visa, MasterCard, etc). Processed by Stripe.
Secured with SSL