33
/
AIzaSyB4mHJ5NPEv-XzF7P6NDYXjlkCWaeKw5bc
November 30, 2025
156494
Indonesia
IDN
true
2
1
PNG, bonds (TDS, current US$)
2016,2015,2014,2013,2012,2011,2010,2009,2008,2007,2006,2005,2004,2003,2002,2001,2000,1999,1998,1997,1996,1995,1994,1993,1992
Create a timeline
Public Timelines
For education
For educational institutions
For teachers
For students
Cabinet
For educational institutions
For teachers
For students
Open cabinet
FAQ
Close
Create a timeline
Public timelines
FAQ
About & Feedback
Terms
Privacy
FAQ
Support 24/7
Cabinet
Get premium
Donate
Download
Global statistics library
→
Indonesia
→
PNG, bonds (TDS, current US$)
This statistics in other country:
Argentina
Botswana
Brazil
Bulgaria
China
Colombia
Costa Rica
Dominican Republic
East Asia & Pacific (excluding high income)
Ecuador
Egypt, Arab Rep.
El Salvador
Europe & Central Asia (excluding high income)
Georgia
Ghana
Guatemala
IDA only
India
Indonesia
Jamaica
Kazakhstan
Lao PDR
Latin America & Caribbean (excluding high income)
Lebanon
Low & middle income
Lower middle income
Malaysia
Mexico
Middle East & North Africa (excluding high income)
Middle income
Mongolia
Nigeria
Pakistan
Panama
Paraguay
Peru
Philippines
Romania
Russian Federation
Serbia
South Africa
South Asia
Sri Lanka
Sub-Saharan Africa (excluding high income)
Thailand
Turkey
Ukraine
Upper middle income
Venezuela, RB
Vietnam
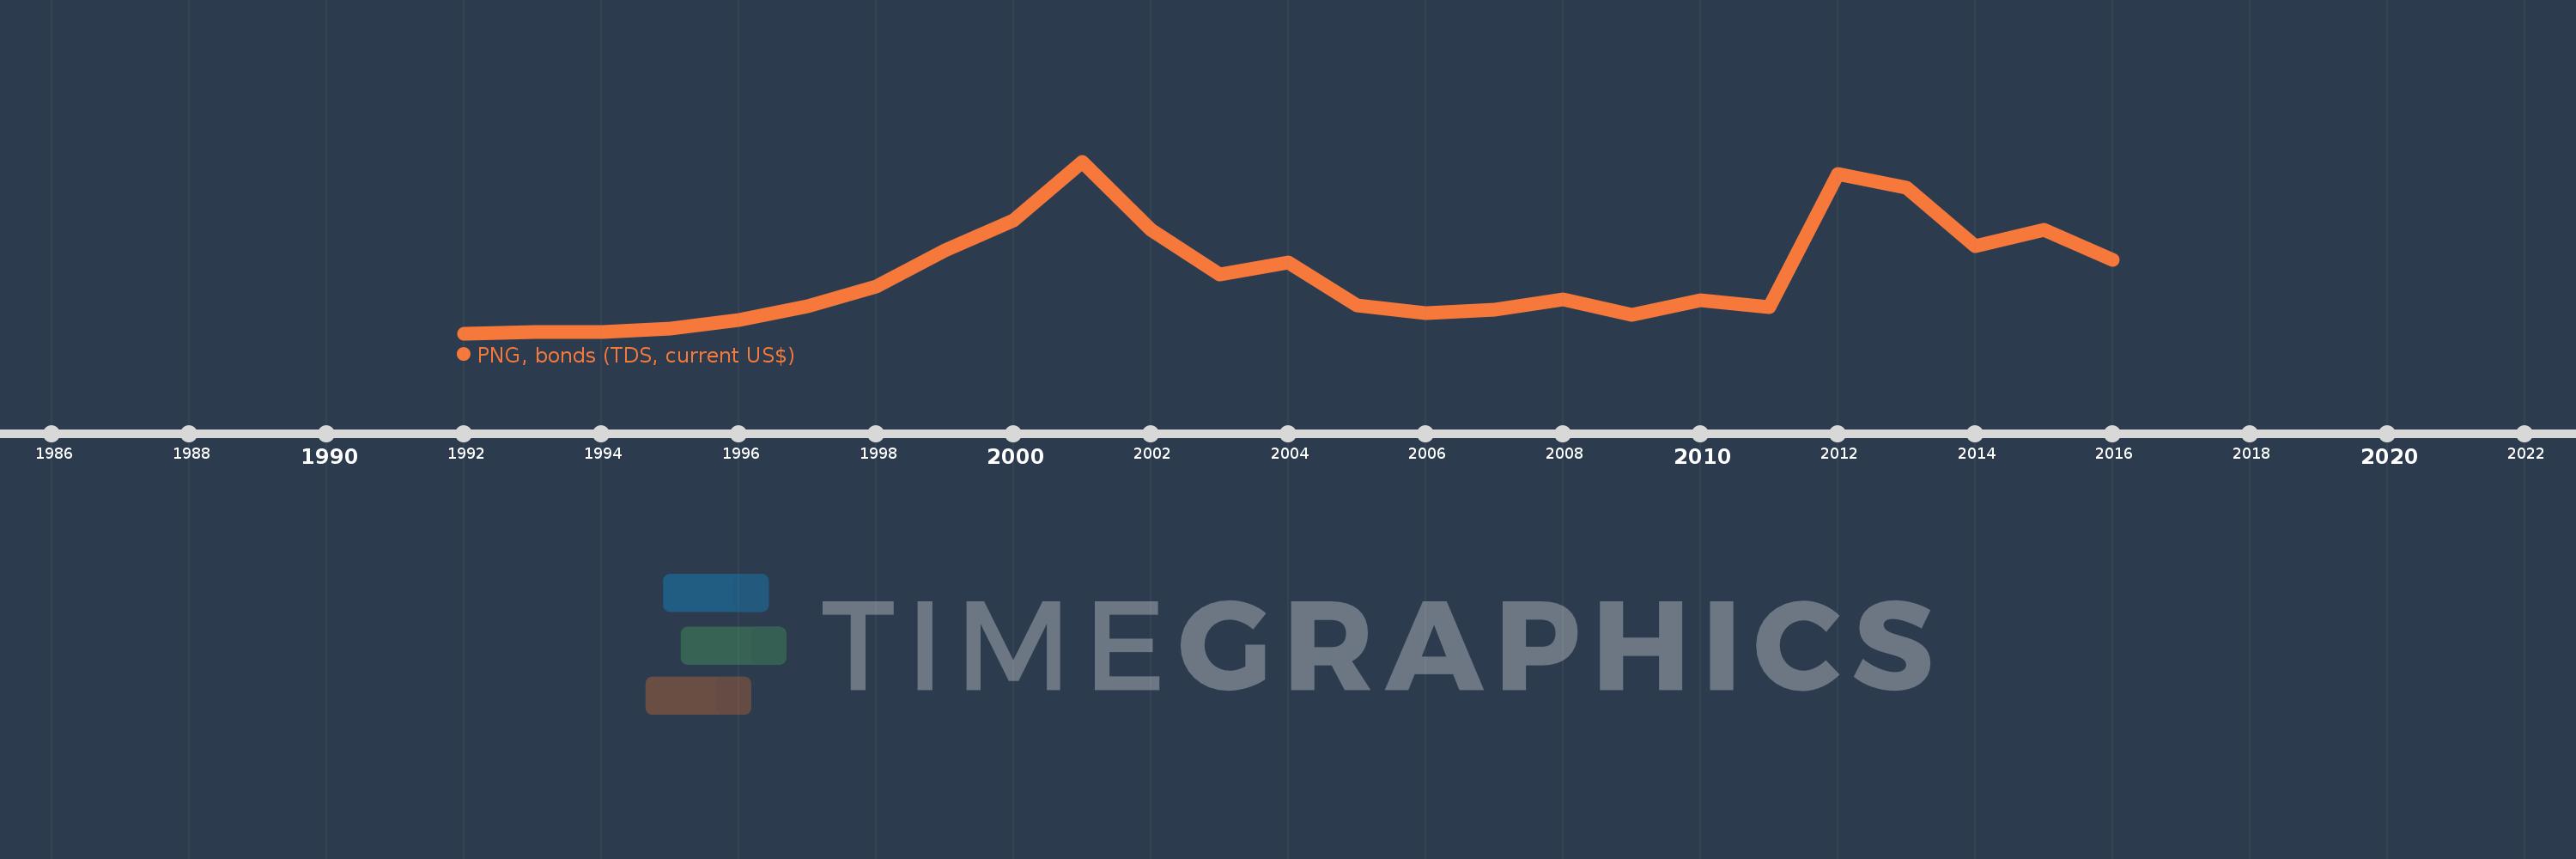
Timeline:
This timeline shows a graph from
1992
to
2016
of Indonesia. No data until
1991
. Number of actual observations by date:
25
.
Source name:
World Development Indicators
Source organization:
World Bank, International Debt Statistics.
Categories, topics:
External Debt
Last updated:
apr 23, 2017
Indicators value changes by year
Meaning:
1.065 bln
Minimum:
12.659 mln
jan 1, 1992
Maximum:
3.135 bln
jan 1, 2001
At the date of observation
Value
Absolute change
Change from the previous value
jan 1, 1992
12.659 mln
+12.659 mln
0.0%
jan 1, 1993
32.307 mln
+19.648 mln
155.21%
jan 1, 1994
40.619 mln
+8.312 mln
25.73%
jan 1, 1995
91.138 mln
+50.519 mln
124.37%
jan 1, 1996
258.982 mln
+167.844 mln
184.16%
jan 1, 1997
501.402 mln
+242.42 mln
93.6%
jan 1, 1998
860.007 mln
+358.605 mln
71.52%
jan 1, 1999
1.518 bln
+658.483 mln
76.57%
jan 1, 2000
2.062 bln
+543.493 mln
35.79%
jan 1, 2001
3.135 bln
+1.073 bln
52.06%
jan 1, 2002
1.897 bln
-1.239 bln
-39.51%
jan 1, 2003
1.083 bln
-813.914 mln
-42.91%
jan 1, 2004
1.297 bln
+214.44 mln
19.81%
jan 1, 2005
513.492 mln
-783.638 mln
-60.41%
jan 1, 2006
380.413 mln
-133.079 mln
-25.92%
jan 1, 2007
440.494 mln
+60.081 mln
15.79%
jan 1, 2008
633.353 mln
+192.859 mln
43.78%
jan 1, 2009
349.257 mln
-284.096 mln
-44.86%
jan 1, 2010
618.217 mln
+268.96 mln
77.01%
jan 1, 2011
492.374 mln
-125.843 mln
-20.36%
jan 1, 2012
2.916 bln
+2.424 bln
492.33%
jan 1, 2013
2.664 bln
-252.426 mln
-8.66%
jan 1, 2014
1.593 bln
-1.071 bln
-40.21%
jan 1, 2015
1.9 bln
+307.261 mln
19.29%
jan 1, 2016
1.341 bln
-559.428 mln
-29.44%
Ranking of countries by current statistics by years
About & Feedback
Terms
Privacy
FAQ
Support 24/7
Cabinet
Get premium
Donate
The service accepts bank transfer (ACH, Wire) or cards (Visa, MasterCard, etc). Processed by Stripe.
Secured with SSL