33
/
AIzaSyB4mHJ5NPEv-XzF7P6NDYXjlkCWaeKw5bc
November 30, 2025
57465
South Asia
SAS
false
2
1
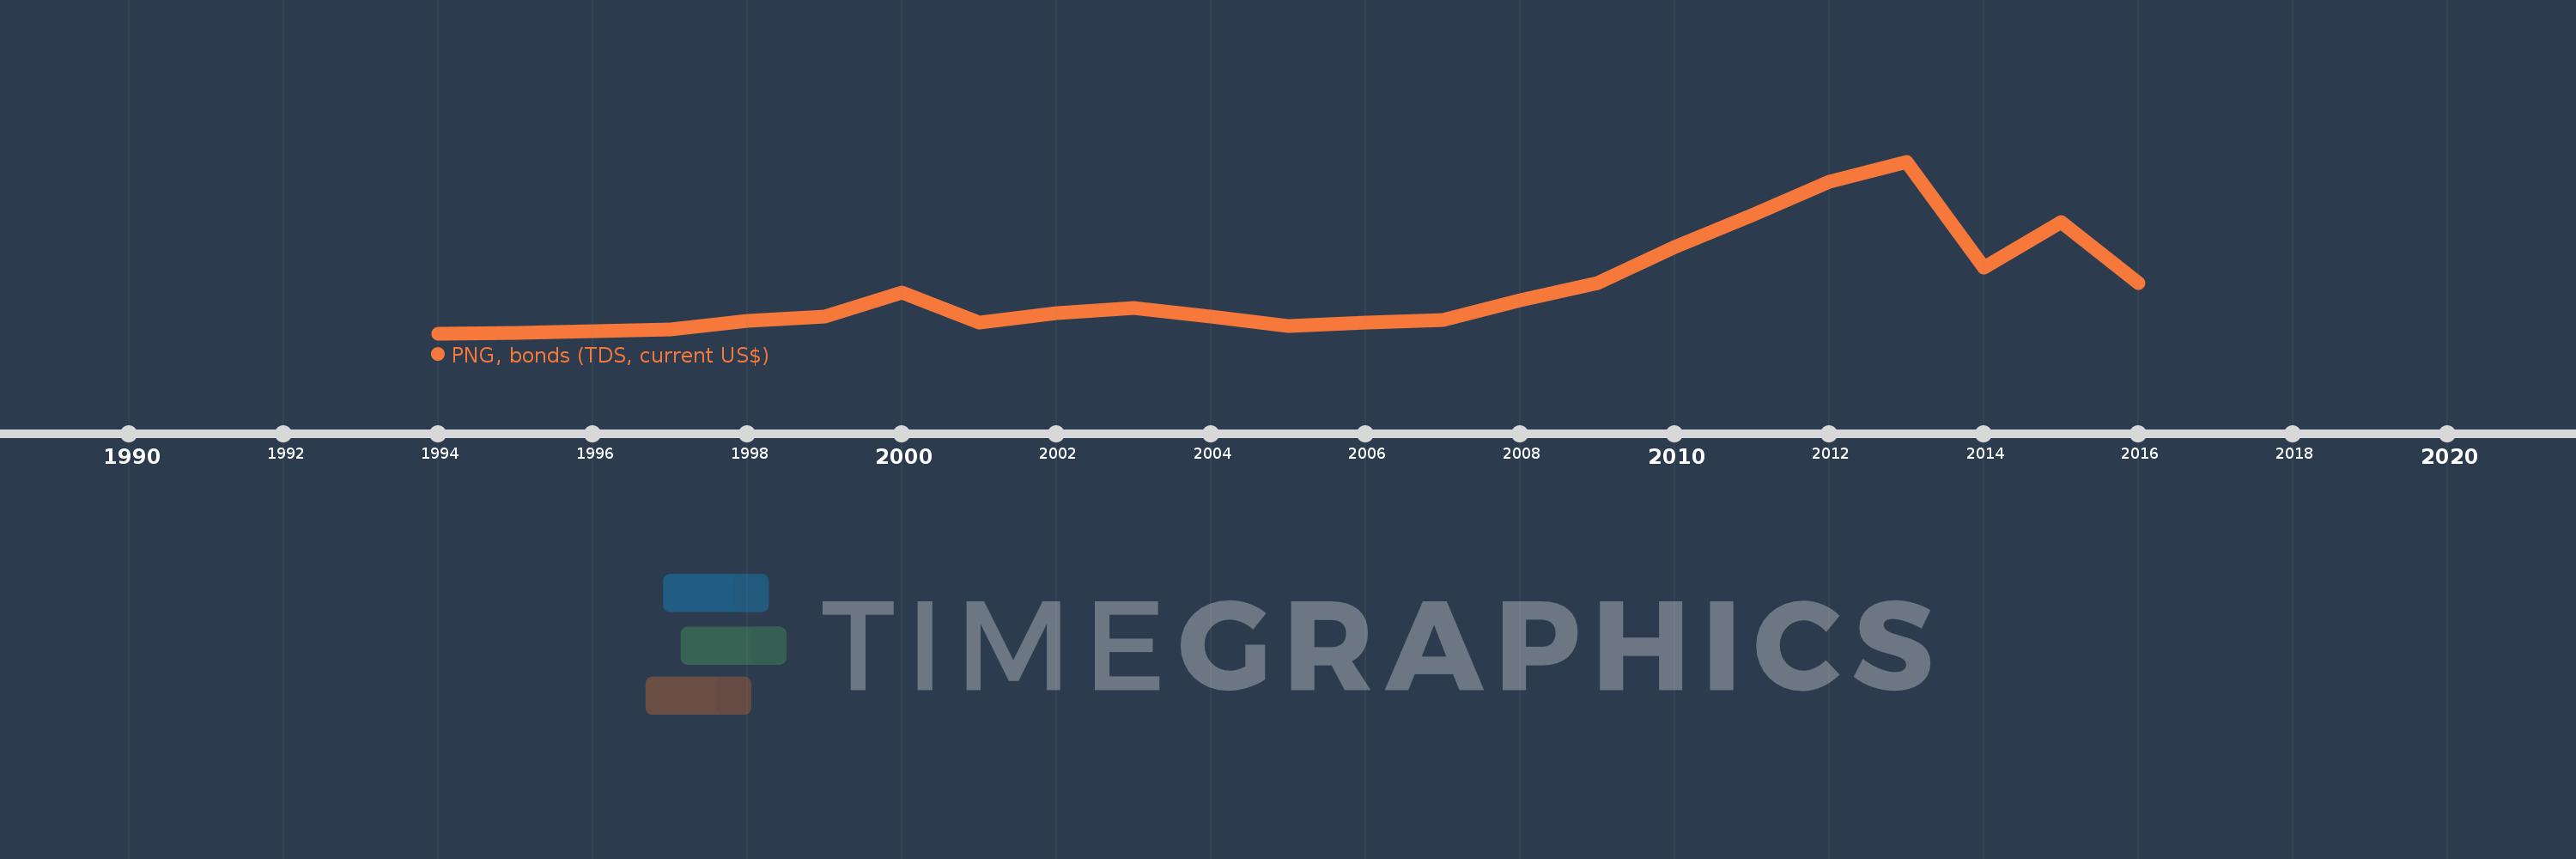
PNG, bonds (TDS, current US$)
2016,2015,2014,2013,2012,2011,2010,2009,2008,2007,2006,2005,2004,2003,2002,2001,2000,1999,1998,1997,1996,1995,1994
Create a timeline
Public Timelines
For education
For educational institutions
For teachers
For students
Cabinet
For educational institutions
For teachers
For students
Open cabinet
FAQ
Close
Create a timeline
Public timelines
FAQ
About & Feedback
Terms
Privacy
FAQ
Support 24/7
Cabinet
Get premium
Donate
Download
Global statistics library
→
South Asia
→
PNG, bonds (TDS, current US$)
This statistics in other country:
Argentina
Botswana
Brazil
Bulgaria
China
Colombia
Costa Rica
Dominican Republic
East Asia & Pacific (excluding high income)
Ecuador
Egypt, Arab Rep.
El Salvador
Europe & Central Asia (excluding high income)
Georgia
Ghana
Guatemala
IDA only
India
Indonesia
Jamaica
Kazakhstan
Lao PDR
Latin America & Caribbean (excluding high income)
Lebanon
Low & middle income
Lower middle income
Malaysia
Mexico
Middle East & North Africa (excluding high income)
Middle income
Mongolia
Nigeria
Pakistan
Panama
Paraguay
Peru
Philippines
Romania
Russian Federation
Serbia
South Africa
South Asia
Sri Lanka
Sub-Saharan Africa (excluding high income)
Thailand
Turkey
Ukraine
Upper middle income
Venezuela, RB
Vietnam
Timeline:
This timeline shows a graph from
1994
to
2016
of South Asia. No data until
1993
. Number of actual observations by date:
23
.
Source name:
World Development Indicators
Source organization:
World Bank, International Debt Statistics.
Categories, topics:
External Debt
Last updated:
apr 23, 2017
Indicators value changes by year
Meaning:
1.089 bln
Minimum:
771.0K
jan 1, 1994
Maximum:
4.216 bln
jan 1, 2013
At the date of observation
Value
Absolute change
Change from the previous value
jan 1, 1994
771.0K
+771.0K
0.0%
jan 1, 1995
20.811 mln
+20.04 mln
2.6K%
jan 1, 1996
58.376 mln
+37.565 mln
180.51%
jan 1, 1997
90.591 mln
+32.215 mln
55.19%
jan 1, 1998
306.316 mln
+215.725 mln
238.13%
jan 1, 1999
416.615 mln
+110.299 mln
36.01%
jan 1, 2000
1.01 bln
+593.328 mln
142.42%
jan 1, 2001
261.569 mln
-748.374 mln
-74.1%
jan 1, 2002
505.439 mln
+243.87 mln
93.23%
jan 1, 2003
617.44 mln
+112.001 mln
22.16%
jan 1, 2004
409.652 mln
-207.788 mln
-33.65%
jan 1, 2005
175.107 mln
-234.545 mln
-57.25%
jan 1, 2006
268.186 mln
+93.079 mln
53.16%
jan 1, 2007
332.786 mln
+64.6 mln
24.09%
jan 1, 2008
813.078 mln
+480.292 mln
144.32%
jan 1, 2009
1.225 bln
+411.846 mln
50.65%
jan 1, 2010
2.125 bln
+900.034 mln
73.48%
jan 1, 2011
2.902 bln
+777.241 mln
36.58%
jan 1, 2012
3.717 bln
+814.508 mln
28.07%
jan 1, 2013
4.216 bln
+498.855 mln
13.42%
jan 1, 2014
1.611 bln
-2.604 bln
-61.78%
jan 1, 2015
2.727 bln
+1.116 bln
69.23%
jan 1, 2016
1.244 bln
-1.483 bln
-54.39%
Ranking of countries by current statistics by years
About & Feedback
Terms
Privacy
FAQ
Support 24/7
Cabinet
Get premium
Donate
The service accepts bank transfer (ACH, Wire) or cards (Visa, MasterCard, etc). Processed by Stripe.
Secured with SSL