Download This statistics in other country:
Timeline:
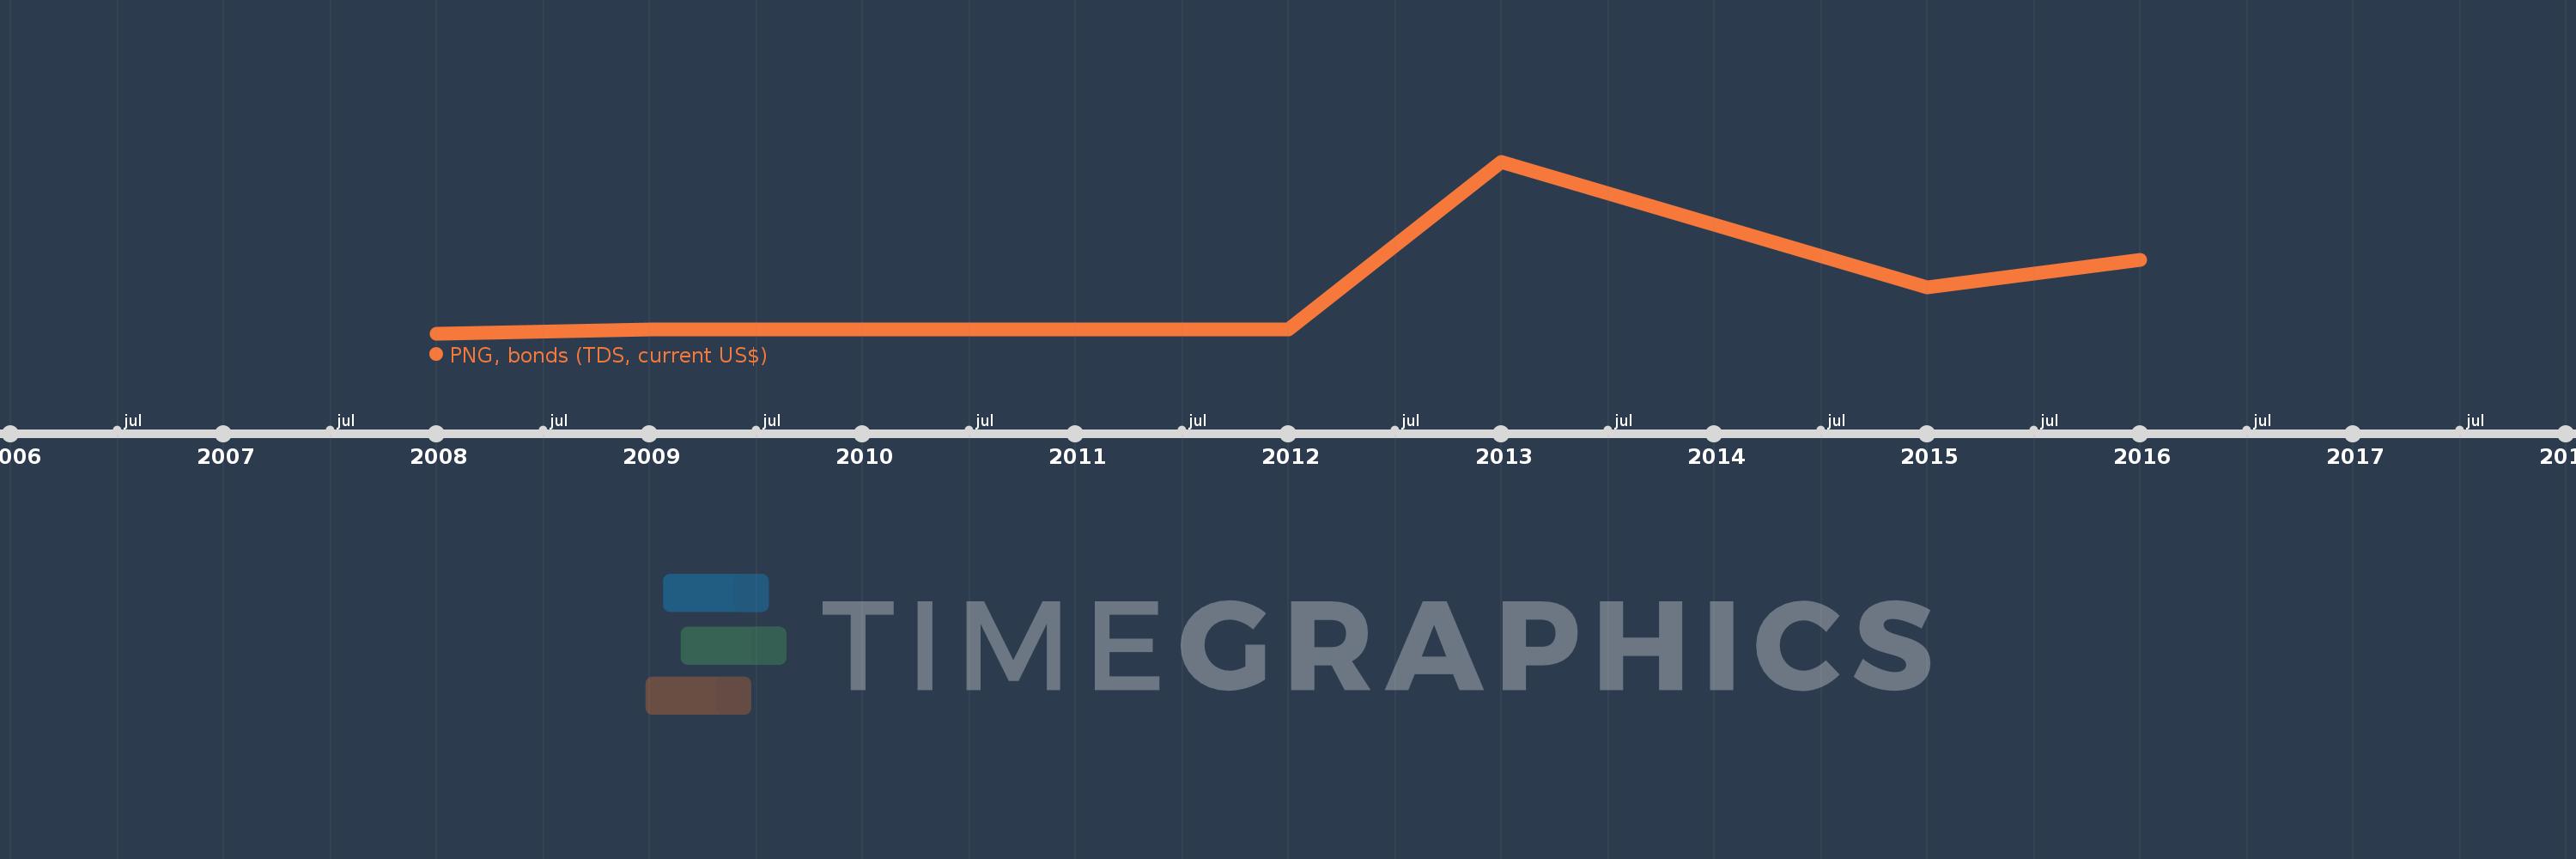
This timeline shows a graph from 2008 to 2016 of Serbia. No data until 2007. Number of actual observations by date: 8.
Source name:
World Development Indicators
Source organization:
World Bank, International Debt Statistics.
Categories, topics:
External Debt
Last updated:
apr 23, 2017
Indicators value changes by year
Minimum:
6.608 mln
jan 1, 2008
Maximum:
170.158 mln
jan 1, 2013
At the date of observation
Value
Absolute change
Change from the previous value
jan 1, 2008
6.608 mln
+6.608 mln
0.0%
jan 1, 2009
9.912 mln
+3.304 mln
50.0%
jan 1, 2010
9.912 mln
0.0
0.0%
jan 1, 2011
9.912 mln
0.0
0.0%
jan 1, 2012
9.912 mln
0.0
0.0%
jan 1, 2013
170.158 mln
+160.246 mln
1.62K%
jan 1, 2015
50.514 mln
-119.644 mln
-70.31%
jan 1, 2016
76.451 mln
+25.937 mln
51.35%
Ranking of countries by current statistics by years