33
/
AIzaSyB4mHJ5NPEv-XzF7P6NDYXjlkCWaeKw5bc
November 30, 2025
281471
Venezuela, RB
VEN
true
2
1
PNG, bonds (TDS, current US$)
2016,2015,2014,2013,2012,2011,2010,2009,2008,2007,2006,2005,2004,2003,2002,2001,2000,1999,1998,1997,1996,1995,1994,1993
Create a timeline
Public Timelines
For education
For educational institutions
For teachers
For students
Cabinet
For educational institutions
For teachers
For students
Open cabinet
FAQ
Close
Create a timeline
Public timelines
FAQ
About & Feedback
Terms
Privacy
FAQ
Support 24/7
Cabinet
Get premium
Donate
Download
Global statistics library
→
Venezuela, RB
→
PNG, bonds (TDS, current US$)
This statistics in other country:
Argentina
Botswana
Brazil
Bulgaria
China
Colombia
Costa Rica
Dominican Republic
East Asia & Pacific (excluding high income)
Ecuador
Egypt, Arab Rep.
El Salvador
Europe & Central Asia (excluding high income)
Georgia
Ghana
Guatemala
IDA only
India
Indonesia
Jamaica
Kazakhstan
Lao PDR
Latin America & Caribbean (excluding high income)
Lebanon
Low & middle income
Lower middle income
Malaysia
Mexico
Middle East & North Africa (excluding high income)
Middle income
Mongolia
Nigeria
Pakistan
Panama
Paraguay
Peru
Philippines
Romania
Russian Federation
Serbia
South Africa
South Asia
Sri Lanka
Sub-Saharan Africa (excluding high income)
Thailand
Turkey
Ukraine
Upper middle income
Venezuela, RB
Vietnam
Timeline:
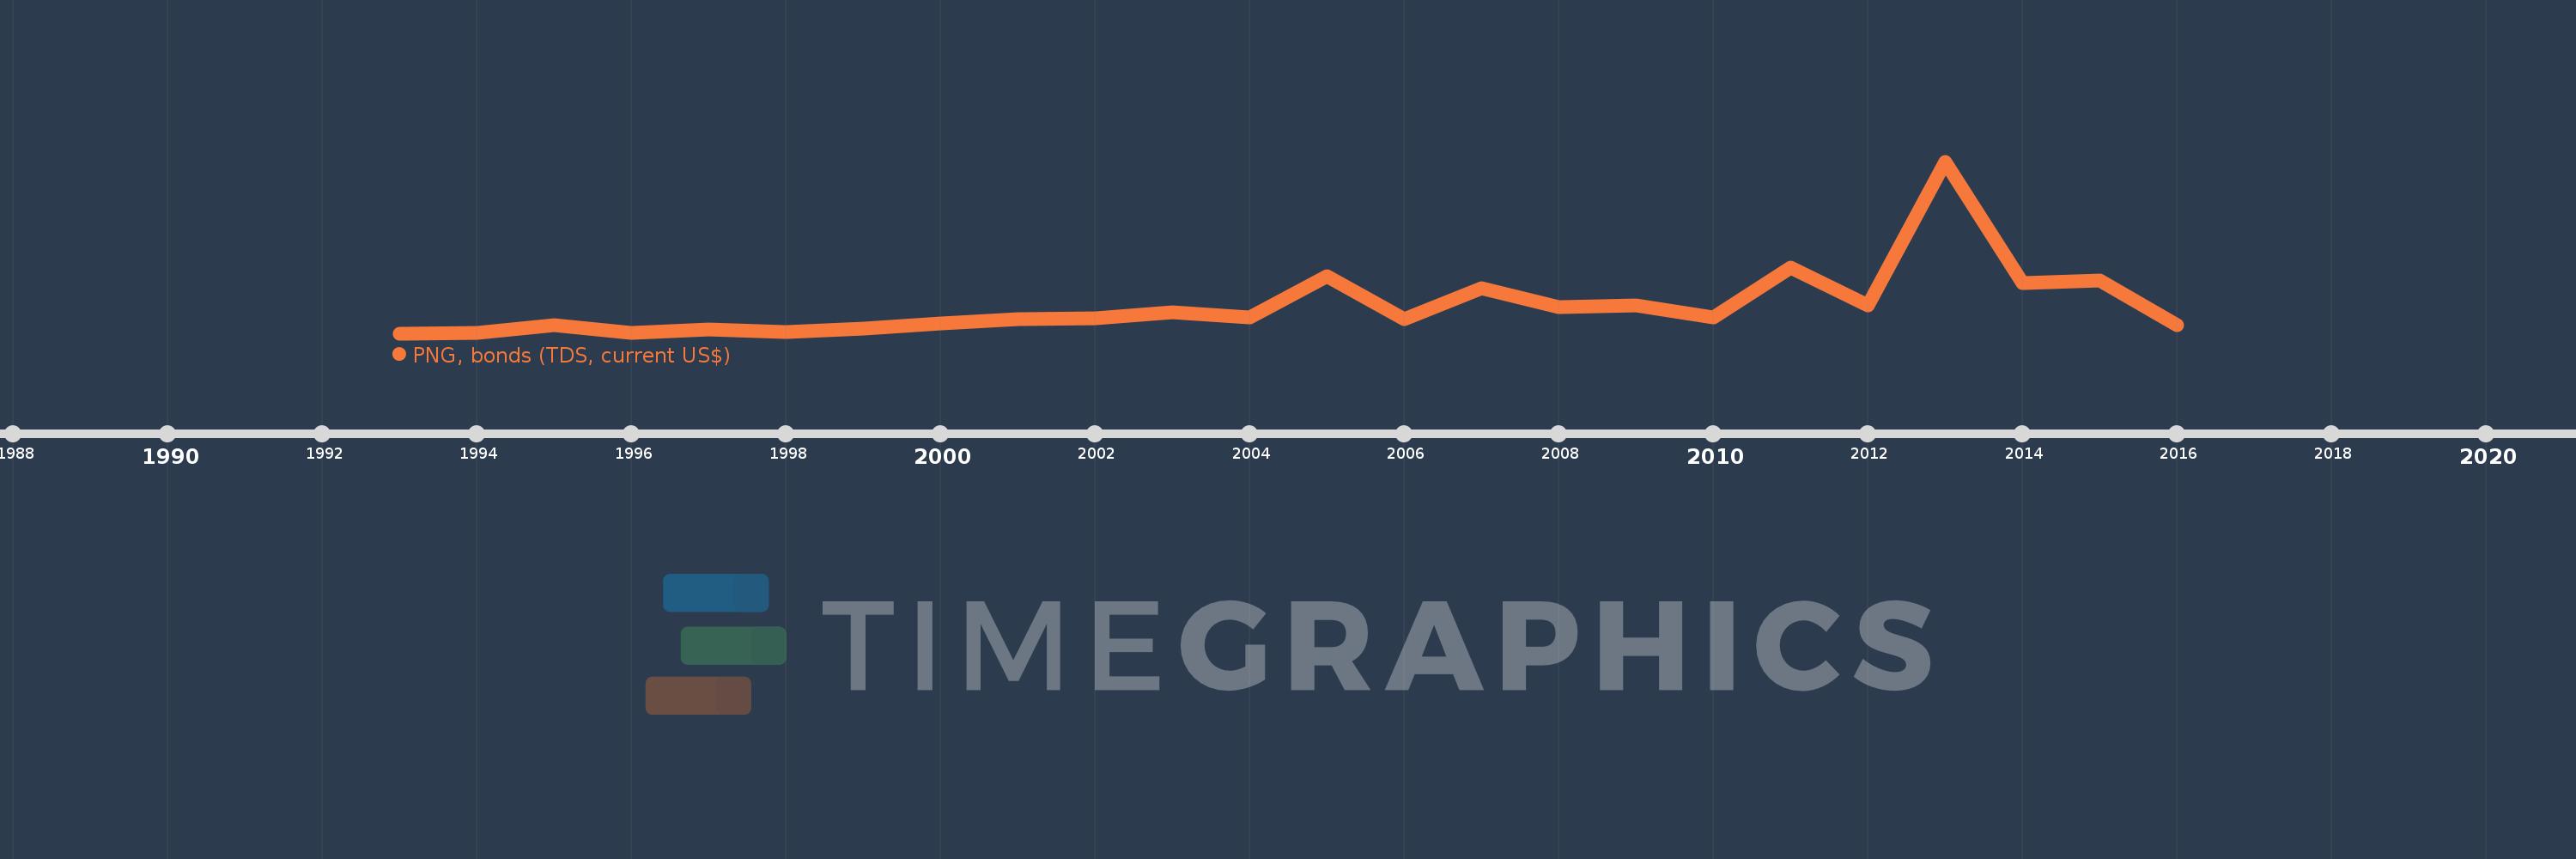
This timeline shows a graph from
1993
to
2016
of Venezuela, RB. No data until
1992
. Number of actual observations by date:
24
.
Source name:
World Development Indicators
Source organization:
World Bank, International Debt Statistics.
Categories, topics:
External Debt
Last updated:
apr 23, 2017
Indicators value changes by year
Meaning:
573.079 mln
Minimum:
2.262 mln
jan 1, 1993
Maximum:
3.578 bln
jan 1, 2013
At the date of observation
Value
Absolute change
Change from the previous value
jan 1, 1993
2.262 mln
+2.262 mln
0.0%
jan 1, 1994
14.356 mln
+12.094 mln
534.66%
jan 1, 1995
169.671 mln
+155.315 mln
1.08K%
jan 1, 1996
9.946 mln
-159.725 mln
-94.14%
jan 1, 1997
84.78 mln
+74.834 mln
752.4%
jan 1, 1998
25.798 mln
-58.982 mln
-69.57%
jan 1, 1999
105.927 mln
+80.129 mln
310.6%
jan 1, 2000
199.896 mln
+93.969 mln
88.71%
jan 1, 2001
304.438 mln
+104.542 mln
52.3%
jan 1, 2002
322.539 mln
+18.101 mln
5.95%
jan 1, 2003
439.123 mln
+116.584 mln
36.15%
jan 1, 2004
337.147 mln
-101.976 mln
-23.22%
jan 1, 2005
1.19 bln
+853.202 mln
253.07%
jan 1, 2006
295.613 mln
-894.736 mln
-75.17%
jan 1, 2007
938.099 mln
+642.486 mln
217.34%
jan 1, 2008
544.602 mln
-393.497 mln
-41.95%
jan 1, 2009
574.408 mln
+29.806 mln
5.47%
jan 1, 2010
336.895 mln
-237.513 mln
-41.35%
jan 1, 2011
1.367 bln
+1.03 bln
305.75%
jan 1, 2012
581.51 mln
-785.429 mln
-57.46%
jan 1, 2013
3.578 bln
+2.996 bln
515.27%
jan 1, 2014
1.055 bln
-2.523 bln
-70.52%
jan 1, 2015
1.111 bln
+56.012 mln
5.31%
jan 1, 2016
166.464 mln
-944.183 mln
-85.01%
Ranking of countries by current statistics by years
About & Feedback
Terms
Privacy
FAQ
Support 24/7
Cabinet
Get premium
Donate
The service accepts bank transfer (ACH, Wire) or cards (Visa, MasterCard, etc). Processed by Stripe.
Secured with SSL