33
/
AIzaSyB4mHJ5NPEv-XzF7P6NDYXjlkCWaeKw5bc
November 30, 2025
218838
Panama
PAN
true
2
1
PNG, bonds (TDS, current US$)
2016,2015,2014,2013,2012,2011,2010,2009,2008,2007,2006,2005,2004,2003,2002,2001,2000,1999,1998
Create a timeline
Public Timelines
For education
For educational institutions
For teachers
For students
Cabinet
For educational institutions
For teachers
For students
Open cabinet
FAQ
Close
Create a timeline
Public timelines
FAQ
About & Feedback
Terms
Privacy
FAQ
Support 24/7
Cabinet
Get premium
Donate
Download
Global statistics library
→
Panama
→
PNG, bonds (TDS, current US$)
This statistics in other country:
Argentina
Botswana
Brazil
Bulgaria
China
Colombia
Costa Rica
Dominican Republic
East Asia & Pacific (excluding high income)
Ecuador
Egypt, Arab Rep.
El Salvador
Europe & Central Asia (excluding high income)
Georgia
Ghana
Guatemala
IDA only
India
Indonesia
Jamaica
Kazakhstan
Lao PDR
Latin America & Caribbean (excluding high income)
Lebanon
Low & middle income
Lower middle income
Malaysia
Mexico
Middle East & North Africa (excluding high income)
Middle income
Mongolia
Nigeria
Pakistan
Panama
Paraguay
Peru
Philippines
Romania
Russian Federation
Serbia
South Africa
South Asia
Sri Lanka
Sub-Saharan Africa (excluding high income)
Thailand
Turkey
Ukraine
Upper middle income
Venezuela, RB
Vietnam
Timeline:
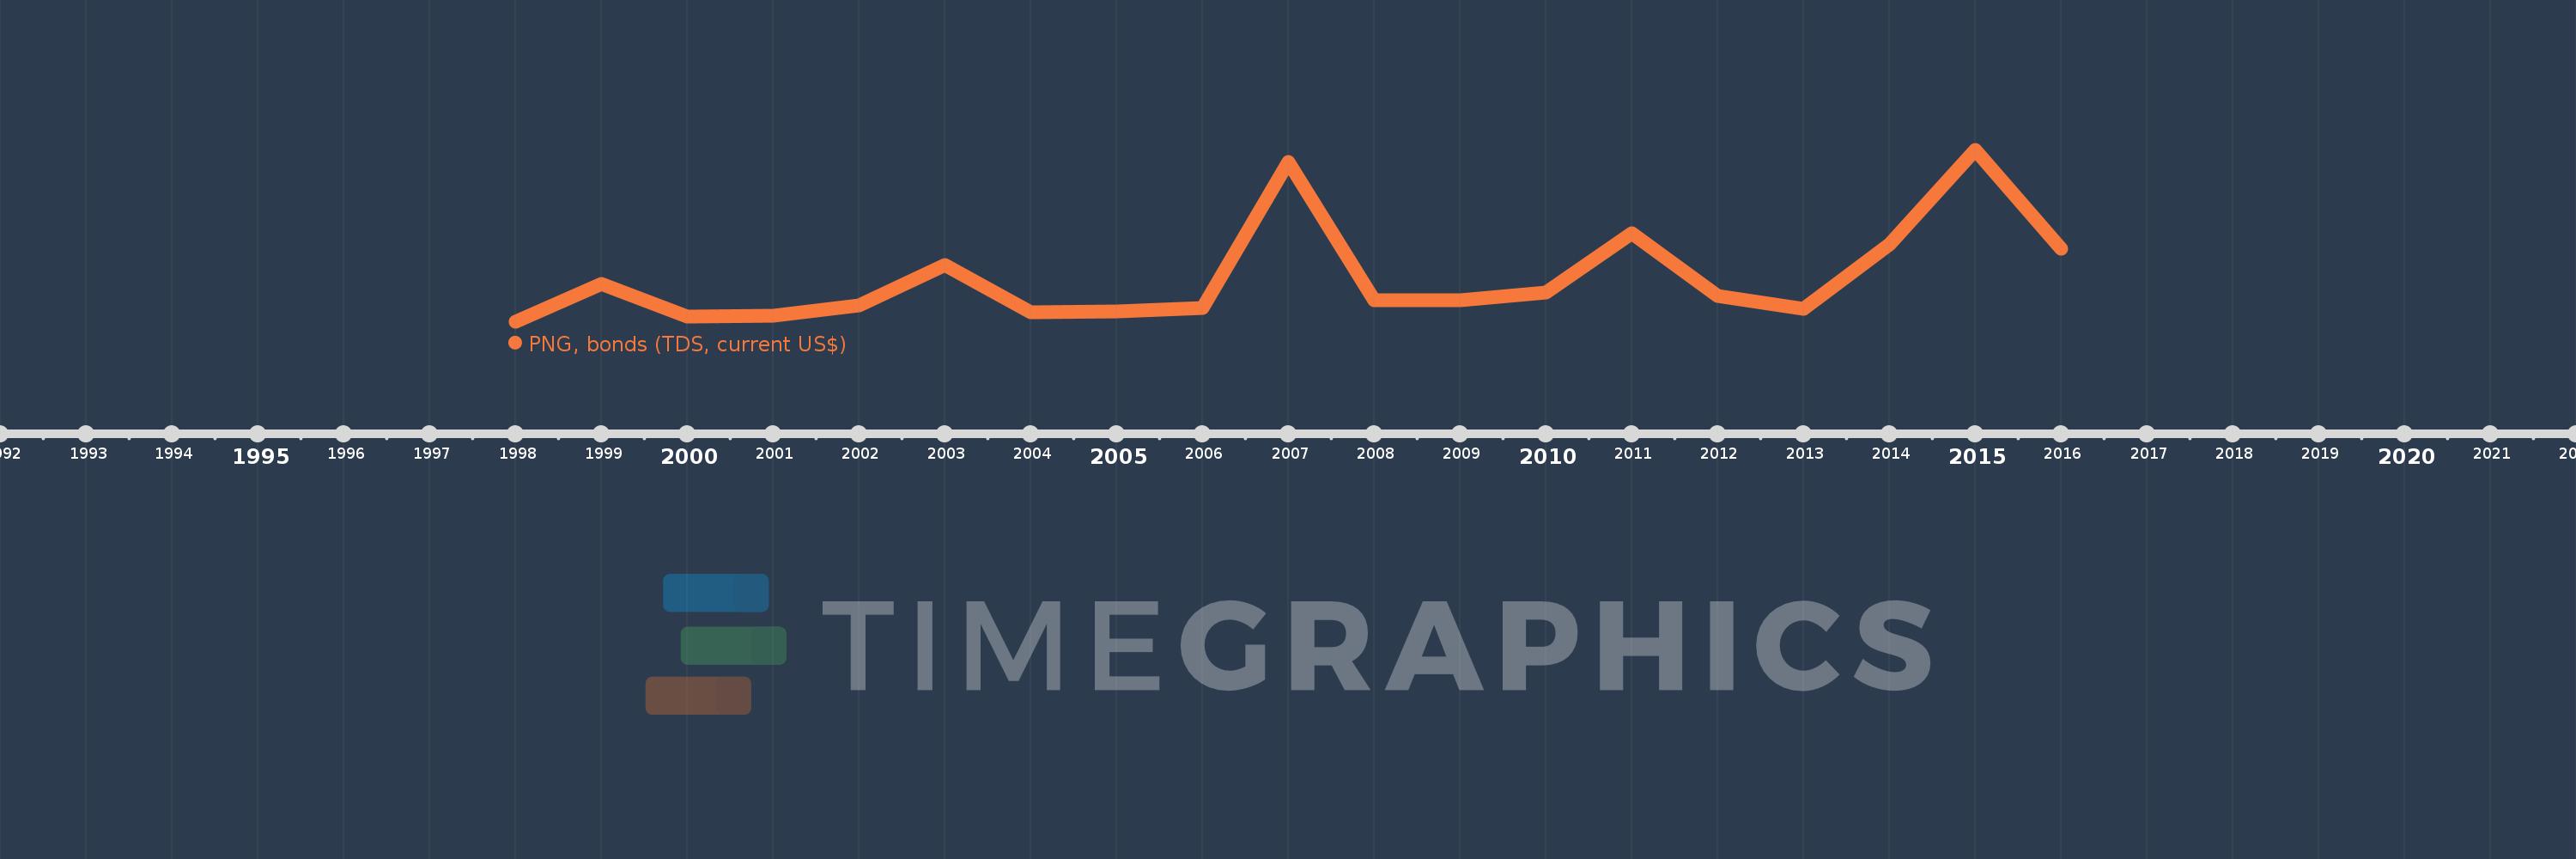
This timeline shows a graph from
1998
to
2016
of Panama. No data until
1997
. Number of actual observations by date:
19
.
Source name:
World Development Indicators
Source organization:
World Bank, International Debt Statistics.
Categories, topics:
External Debt
Last updated:
apr 23, 2017
Indicators value changes by year
Meaning:
120.452 mln
Minimum:
7.5 mln
jan 1, 1998
Maximum:
445.647 mln
jan 1, 2015
At the date of observation
Value
Absolute change
Change from the previous value
jan 1, 1998
7.5 mln
+7.5 mln
0.0%
jan 1, 1999
104.846 mln
+97.346 mln
1.3K%
jan 1, 2000
22.346 mln
-82.5 mln
-78.69%
jan 1, 2001
23.848 mln
+1.502 mln
6.72%
jan 1, 2002
50.616 mln
+26.768 mln
112.24%
jan 1, 2003
152.51 mln
+101.894 mln
201.31%
jan 1, 2004
32.151 mln
-120.359 mln
-78.92%
jan 1, 2005
33.566 mln
+1.415 mln
4.4%
jan 1, 2006
43.985 mln
+10.419 mln
31.04%
jan 1, 2007
414.658 mln
+370.673 mln
842.73%
jan 1, 2008
62.88 mln
-351.778 mln
-84.84%
jan 1, 2009
63.366 mln
+486.0K
0.77%
jan 1, 2010
83.052 mln
+19.686 mln
31.07%
jan 1, 2011
233.052 mln
+150.0 mln
180.61%
jan 1, 2012
73.114 mln
-159.938 mln
-68.63%
jan 1, 2013
41.766 mln
-31.348 mln
-42.88%
jan 1, 2014
205.038 mln
+163.272 mln
390.92%
jan 1, 2015
445.647 mln
+240.609 mln
117.35%
jan 1, 2016
194.652 mln
-250.995 mln
-56.32%
Ranking of countries by current statistics by years
About & Feedback
Terms
Privacy
FAQ
Support 24/7
Cabinet
Get premium
Donate
The service accepts bank transfer (ACH, Wire) or cards (Visa, MasterCard, etc). Processed by Stripe.
Secured with SSL