33
/
AIzaSyB4mHJ5NPEv-XzF7P6NDYXjlkCWaeKw5bc
November 30, 2025
269837
Turkey
TUR
true
2
1
PNG, bonds (TDS, current US$)
2016,2015,2014,2013,2012,2011,2010,2009,2008,2007,2006,2005,2004,2003,2002,2001,2000,1999,1998,1997,1996,1995,1994,1993,1992,1991
Create a timeline
Public Timelines
For education
For educational institutions
For teachers
For students
Cabinet
For educational institutions
For teachers
For students
Open cabinet
FAQ
Close
Create a timeline
Public timelines
FAQ
About & Feedback
Terms
Privacy
FAQ
Support 24/7
Cabinet
Get premium
Donate
Download
Global statistics library
→
Turkey
→
PNG, bonds (TDS, current US$)
This statistics in other country:
Argentina
Botswana
Brazil
Bulgaria
China
Colombia
Costa Rica
Dominican Republic
East Asia & Pacific (excluding high income)
Ecuador
Egypt, Arab Rep.
El Salvador
Europe & Central Asia (excluding high income)
Georgia
Ghana
Guatemala
IDA only
India
Indonesia
Jamaica
Kazakhstan
Lao PDR
Latin America & Caribbean (excluding high income)
Lebanon
Low & middle income
Lower middle income
Malaysia
Mexico
Middle East & North Africa (excluding high income)
Middle income
Mongolia
Nigeria
Pakistan
Panama
Paraguay
Peru
Philippines
Romania
Russian Federation
Serbia
South Africa
South Asia
Sri Lanka
Sub-Saharan Africa (excluding high income)
Thailand
Turkey
Ukraine
Upper middle income
Venezuela, RB
Vietnam
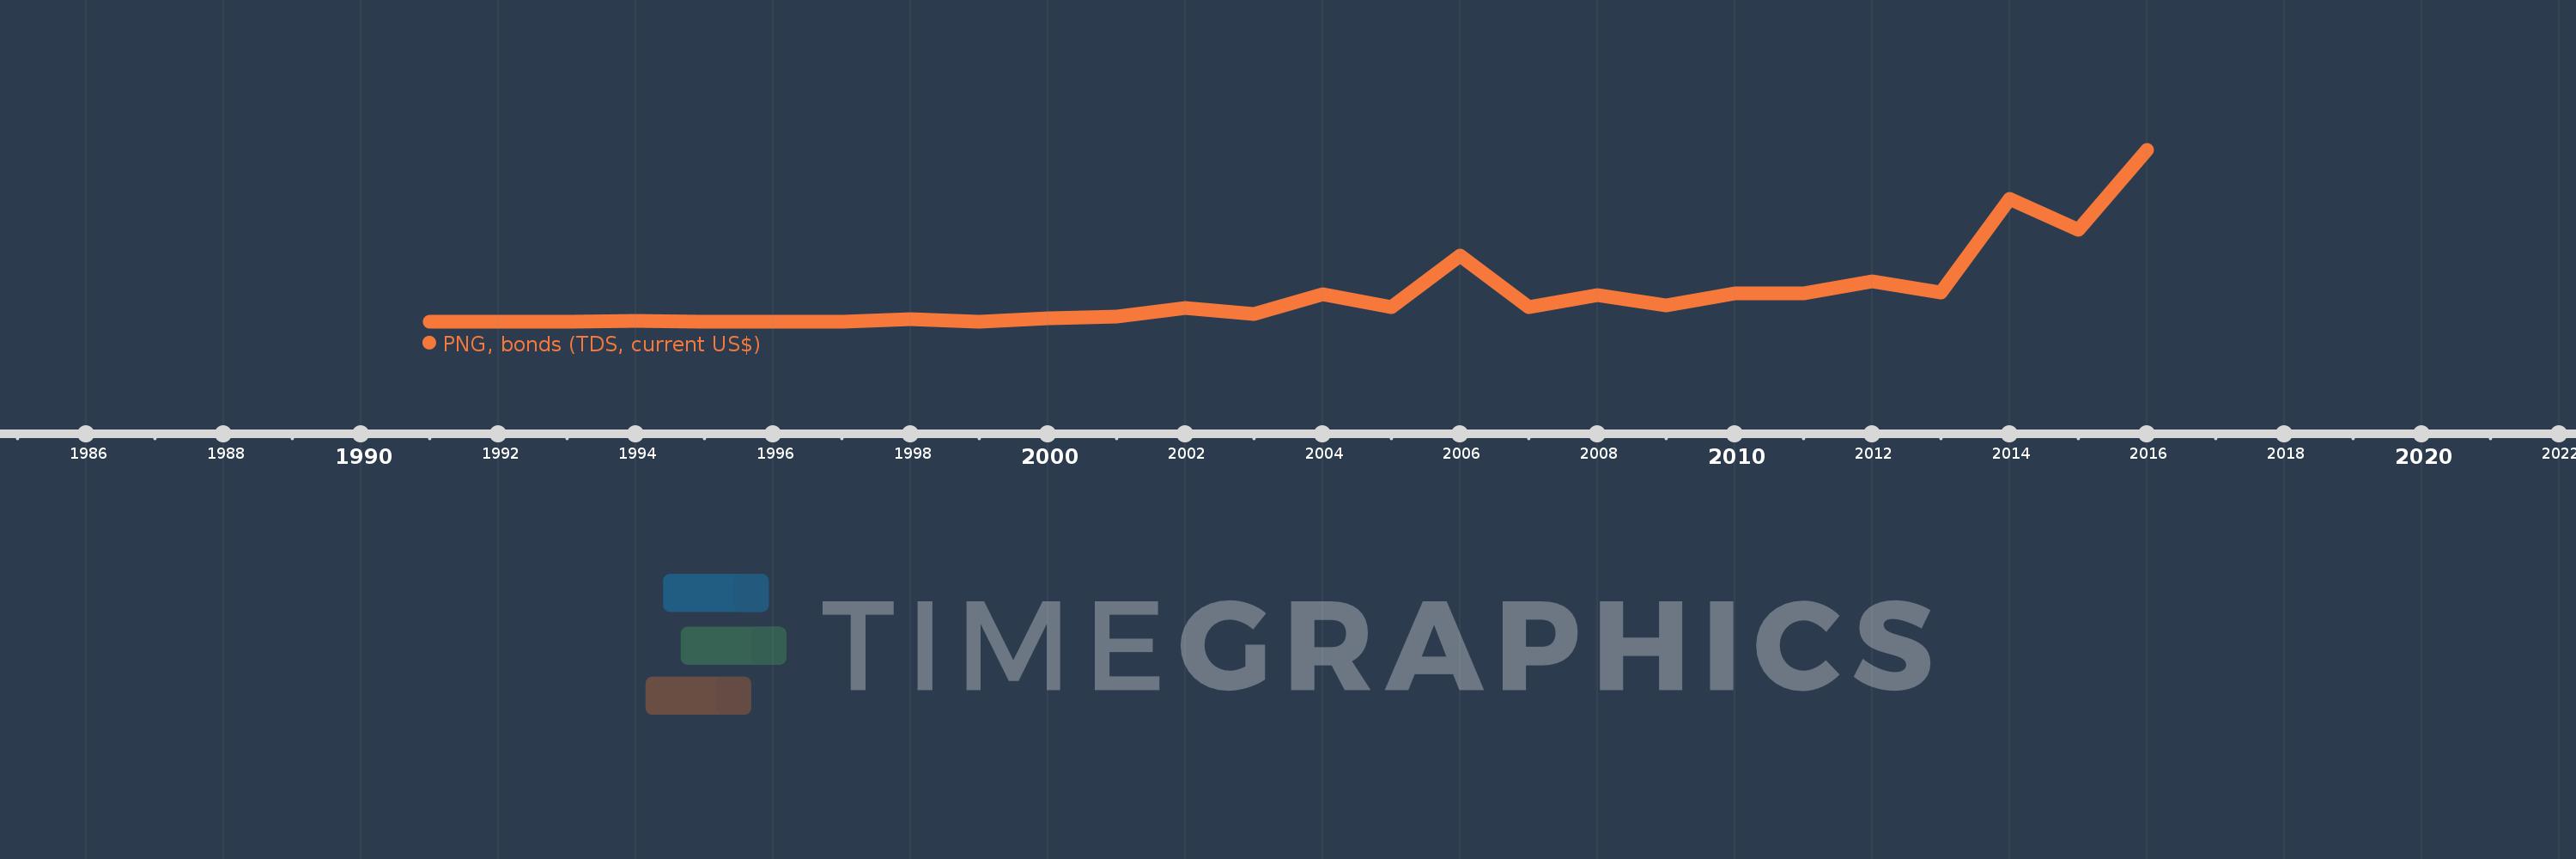
Timeline:
This timeline shows a graph from
1991
to
2016
of Turkey. No data until
1990
. Number of actual observations by date:
26
.
Source name:
World Development Indicators
Source organization:
World Bank, International Debt Statistics.
Categories, topics:
External Debt
Last updated:
apr 23, 2017
Indicators value changes by year
Meaning:
622.134 mln
Minimum:
1.36 mln
jan 1, 1991
Maximum:
3.866 bln
jan 1, 2016
At the date of observation
Value
Absolute change
Change from the previous value
jan 1, 1991
1.36 mln
+1.36 mln
0.0%
jan 1, 1992
1.36 mln
0.0
0.0%
jan 1, 1993
2.045 mln
+685.0K
50.37%
jan 1, 1994
18.43 mln
+16.385 mln
801.22%
jan 1, 1995
1.94 mln
-16.49 mln
-89.47%
jan 1, 1996
12.793 mln
+10.853 mln
559.43%
jan 1, 1997
12.125 mln
-668.0K
-5.22%
jan 1, 1998
63.262 mln
+51.137 mln
421.75%
jan 1, 1999
11.83 mln
-51.432 mln
-81.3%
jan 1, 2000
85.851 mln
+74.021 mln
625.71%
jan 1, 2001
126.313 mln
+40.462 mln
47.13%
jan 1, 2002
319.419 mln
+193.106 mln
152.88%
jan 1, 2003
182.647 mln
-136.772 mln
-42.82%
jan 1, 2004
620.417 mln
+437.77 mln
239.68%
jan 1, 2005
337.194 mln
-283.223 mln
-45.65%
jan 1, 2006
1.488 bln
+1.151 bln
341.2%
jan 1, 2007
327.883 mln
-1.16 bln
-77.96%
jan 1, 2008
612.249 mln
+284.366 mln
86.73%
jan 1, 2009
370.739 mln
-241.51 mln
-39.45%
jan 1, 2010
637.615 mln
+266.876 mln
71.98%
jan 1, 2011
647.724 mln
+10.109 mln
1.59%
jan 1, 2012
907.313 mln
+259.589 mln
40.08%
jan 1, 2013
669.869 mln
-237.444 mln
-26.17%
jan 1, 2014
2.778 bln
+2.108 bln
314.76%
jan 1, 2015
2.073 bln
-705.051 mln
-25.38%
jan 1, 2016
3.866 bln
+1.792 bln
86.46%
Ranking of countries by current statistics by years
About & Feedback
Terms
Privacy
FAQ
Support 24/7
Cabinet
Get premium
Donate
The service accepts bank transfer (ACH, Wire) or cards (Visa, MasterCard, etc). Processed by Stripe.
Secured with SSL