33
/
AIzaSyB4mHJ5NPEv-XzF7P6NDYXjlkCWaeKw5bc
November 30, 2025
166641
Kazakhstan
KAZ
true
2
1
PNG, bonds (TDS, current US$)
2016,2015,2014,2013,2012,2011,2010,2009,2008,2007,2006,2005,2004,2003,2002,2001,2000
Create a timeline
Public Timelines
For education
For educational institutions
For teachers
For students
Cabinet
For educational institutions
For teachers
For students
Open cabinet
FAQ
Close
Create a timeline
Public timelines
FAQ
About & Feedback
Terms
Privacy
FAQ
Support 24/7
Cabinet
Get premium
Donate
Download
Global statistics library
→
Kazakhstan
→
PNG, bonds (TDS, current US$)
This statistics in other country:
Argentina
Botswana
Brazil
Bulgaria
China
Colombia
Costa Rica
Dominican Republic
East Asia & Pacific (excluding high income)
Ecuador
Egypt, Arab Rep.
El Salvador
Europe & Central Asia (excluding high income)
Georgia
Ghana
Guatemala
IDA only
India
Indonesia
Jamaica
Kazakhstan
Lao PDR
Latin America & Caribbean (excluding high income)
Lebanon
Low & middle income
Lower middle income
Malaysia
Mexico
Middle East & North Africa (excluding high income)
Middle income
Mongolia
Nigeria
Pakistan
Panama
Paraguay
Peru
Philippines
Romania
Russian Federation
Serbia
South Africa
South Asia
Sri Lanka
Sub-Saharan Africa (excluding high income)
Thailand
Turkey
Ukraine
Upper middle income
Venezuela, RB
Vietnam
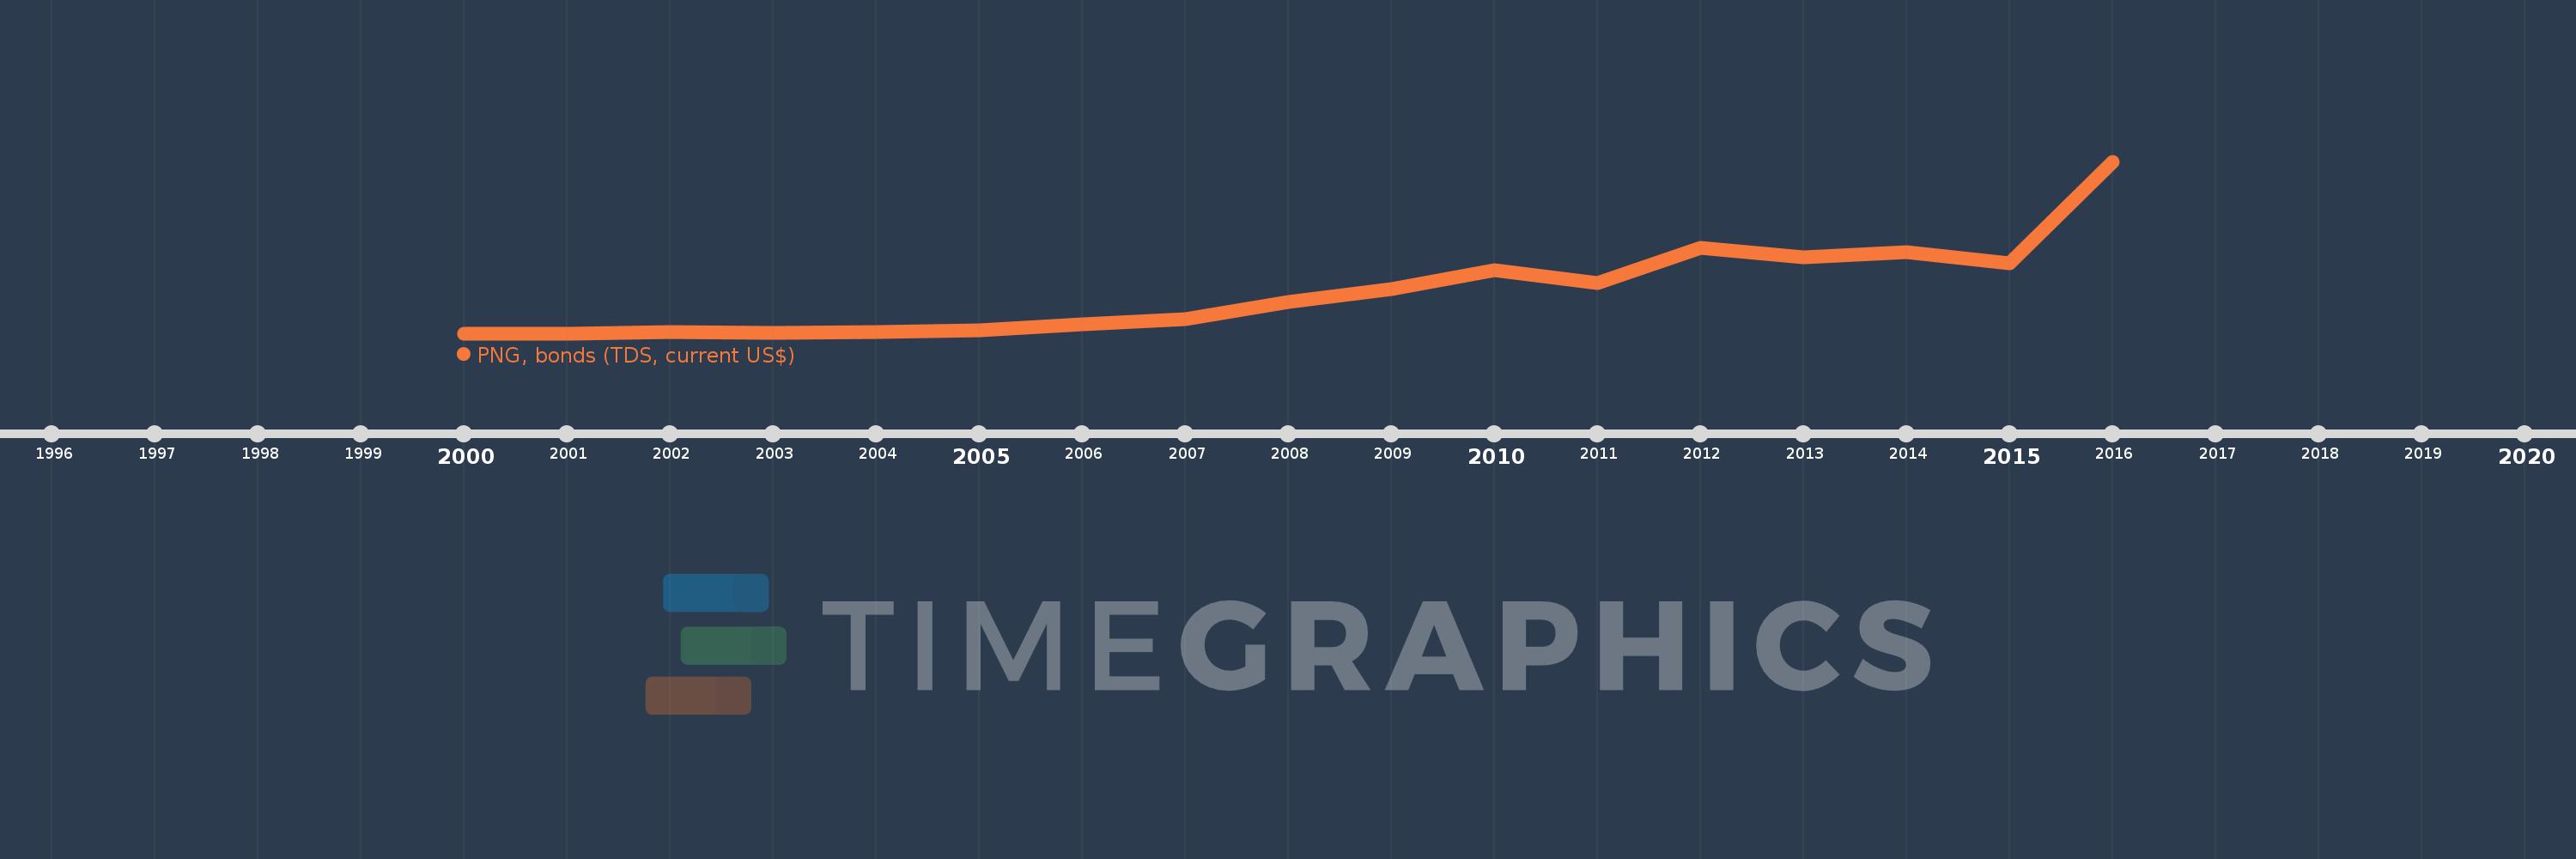
Timeline:
This timeline shows a graph from
2000
to
2016
of Kazakhstan. No data until
1999
. Number of actual observations by date:
17
.
Source name:
World Development Indicators
Source organization:
World Bank, International Debt Statistics.
Categories, topics:
External Debt
Last updated:
apr 23, 2017
Indicators value changes by year
Meaning:
2.488 bln
Minimum:
11.25 mln
jan 1, 2000
Maximum:
10.288 bln
jan 1, 2016
At the date of observation
Value
Absolute change
Change from the previous value
jan 1, 2000
11.25 mln
+11.25 mln
0.0%
jan 1, 2001
11.25 mln
0.0
0.0%
jan 1, 2002
111.375 mln
+100.125 mln
890.0%
jan 1, 2003
26.625 mln
-84.75 mln
-76.09%
jan 1, 2004
99.429 mln
+72.804 mln
273.44%
jan 1, 2005
196.208 mln
+96.779 mln
97.33%
jan 1, 2006
543.266 mln
+347.058 mln
176.88%
jan 1, 2007
833.675 mln
+290.409 mln
53.46%
jan 1, 2008
1.91 bln
+1.076 bln
129.11%
jan 1, 2009
2.652 bln
+742.037 mln
38.85%
jan 1, 2010
3.813 bln
+1.161 bln
43.79%
jan 1, 2011
3.028 bln
-784.954 mln
-20.58%
jan 1, 2012
5.131 bln
+2.103 bln
69.44%
jan 1, 2013
4.572 bln
-558.876 mln
-10.89%
jan 1, 2014
4.864 bln
+291.771 mln
6.38%
jan 1, 2015
4.207 bln
-657.369 mln
-13.51%
jan 1, 2016
10.288 bln
+6.081 bln
144.54%
Ranking of countries by current statistics by years
About & Feedback
Terms
Privacy
FAQ
Support 24/7
Cabinet
Get premium
Donate
The service accepts bank transfer (ACH, Wire) or cards (Visa, MasterCard, etc). Processed by Stripe.
Secured with SSL