Download This statistics in other country:
Timeline:
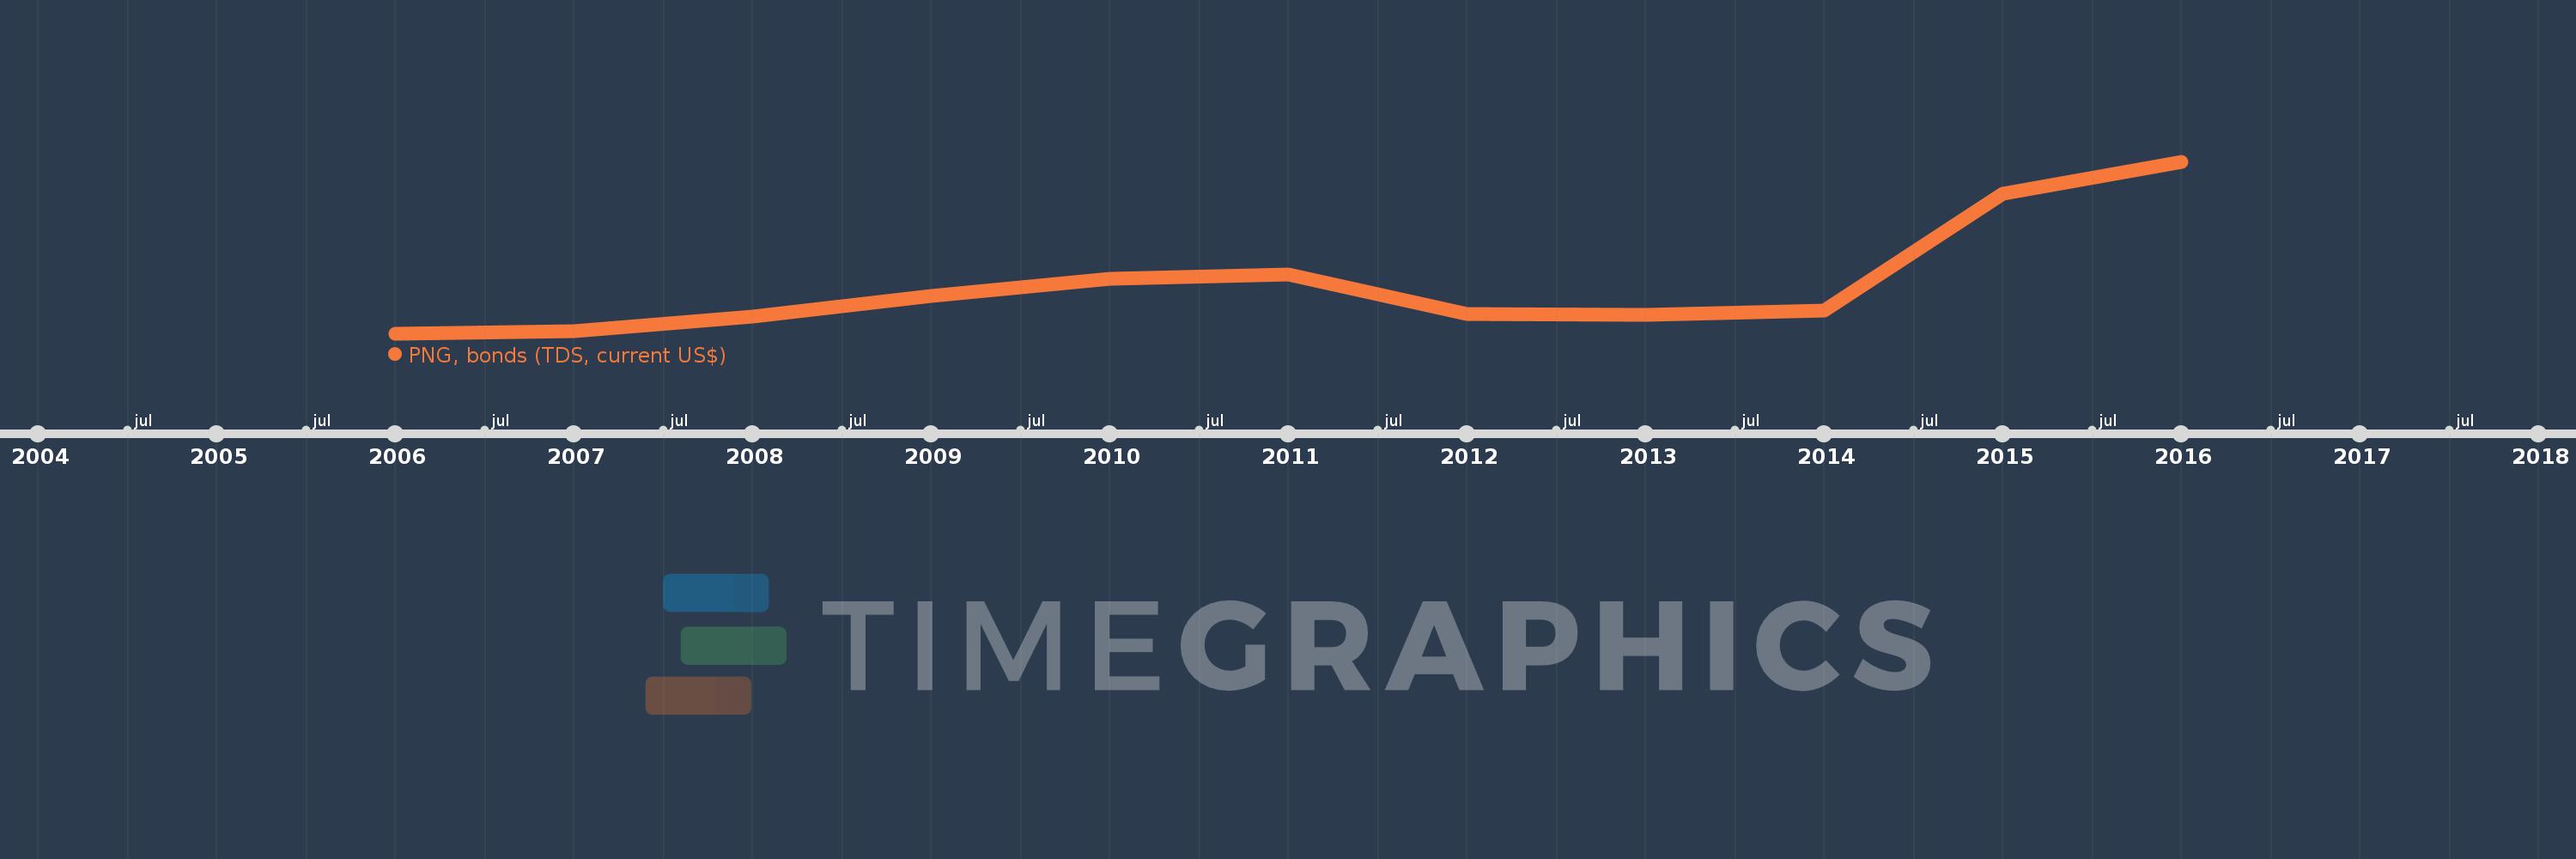
This timeline shows a graph from 2006 to 2016 of Ukraine. No data until 2005. Number of actual observations by date: 11.
Source name:
World Development Indicators
Source organization:
World Bank, International Debt Statistics.
Categories, topics:
External Debt
Last updated:
apr 23, 2017
Indicators value changes by year
Minimum:
41.297 mln
jan 1, 2006
Maximum:
3.432 bln
jan 1, 2016
At the date of observation
Value
Absolute change
Change from the previous value
jan 1, 2006
41.297 mln
+41.297 mln
0.0%
jan 1, 2007
88.515 mln
+47.218 mln
114.34%
jan 1, 2008
376.805 mln
+288.29 mln
325.7%
jan 1, 2009
785.715 mln
+408.91 mln
108.52%
jan 1, 2010
1.118 bln
+332.485 mln
42.32%
jan 1, 2011
1.208 bln
+89.853 mln
8.04%
jan 1, 2012
422.506 mln
-785.547 mln
-65.03%
jan 1, 2013
403.145 mln
-19.361 mln
-4.58%
jan 1, 2014
496.546 mln
+93.401 mln
23.17%
jan 1, 2015
2.802 bln
+2.305 bln
464.29%
jan 1, 2016
3.432 bln
+629.828 mln
22.48%
Ranking of countries by current statistics by years