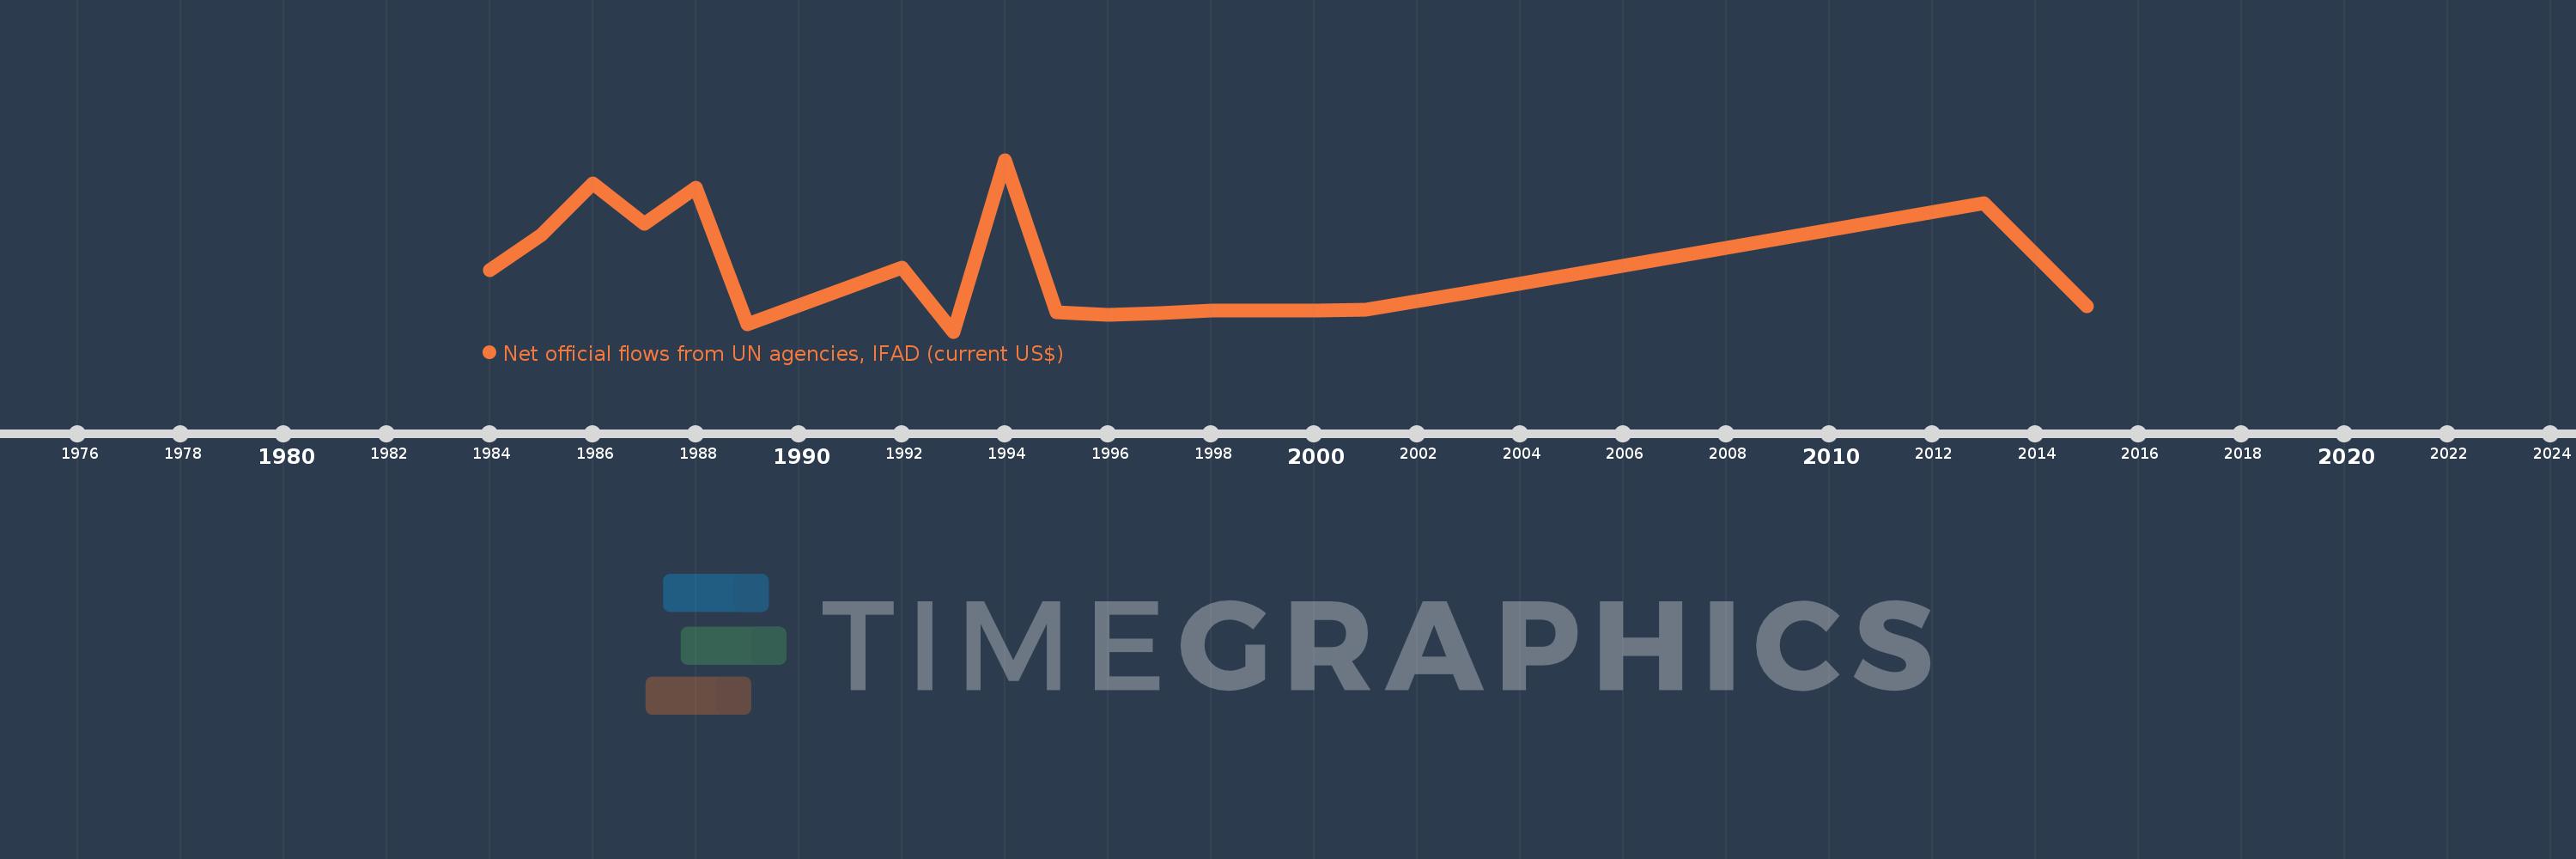
This timeline shows a graph from 1984 to 2015 of Botswana. No data until 1983. Number of actual observations by date: 19.
Source name:
World Development Indicators
Source organization:
Development Assistance Committee of the Organisation for Economic Co-operation and Development, Geographical Distribution of Financial Flows to Developing Countries, Development Co-operation Report, and International Development Statistics database. Data are available online at: www.oecd.org/dac/stats/idsonline.
Categories, topics:
Aid Effectiveness
Last updated:
apr 23, 2017
Indicators value changes by year
Meaning:
36.842K
Minimum:
-450.0K
jan 1, 1993
Maximum:
950.0K
jan 1, 1994
At the date of observation
Value
Absolute change
Change from the previous value
jan 1, 1984
50.0K
+50.0K
0.0%
jan 1, 1985
340.0K
+290.0K
580.0%
jan 1, 1986
760.0K
+420.0K
123.53%
jan 1, 1987
430.0K
-330.0K
-43.42%
jan 1, 1988
720.0K
+290.0K
67.44%
jan 1, 1989
-390.0K
-1.11 mln
-154.17%
jan 1, 1992
70.0K
+460.0K
-117.95%
jan 1, 1993
-450.0K
-520.0K
-742.86%
jan 1, 1994
950.0K
+1.4 mln
-311.11%
jan 1, 1995
-290.0K
-1.24 mln
-130.53%
jan 1, 1996
-310.0K
-20.0K
6.9%
jan 1, 1997
-300.0K
+10.0K
-3.23%
jan 1, 1998
-280.0K
+20.0K
-6.67%
jan 1, 1999
-280.0K
0.0
0.0%
jan 1, 2000
-280.0K
0.0
0.0%
jan 1, 2001
-270.0K
+10.0K
-3.57%
jan 1, 2003
-130.0K
+140.0K
-51.85%
jan 1, 2013
600.0K
+730.0K
-561.54%
jan 1, 2015
-240.0K
-840.0K
-140.0%
Ranking of countries by current statistics by years