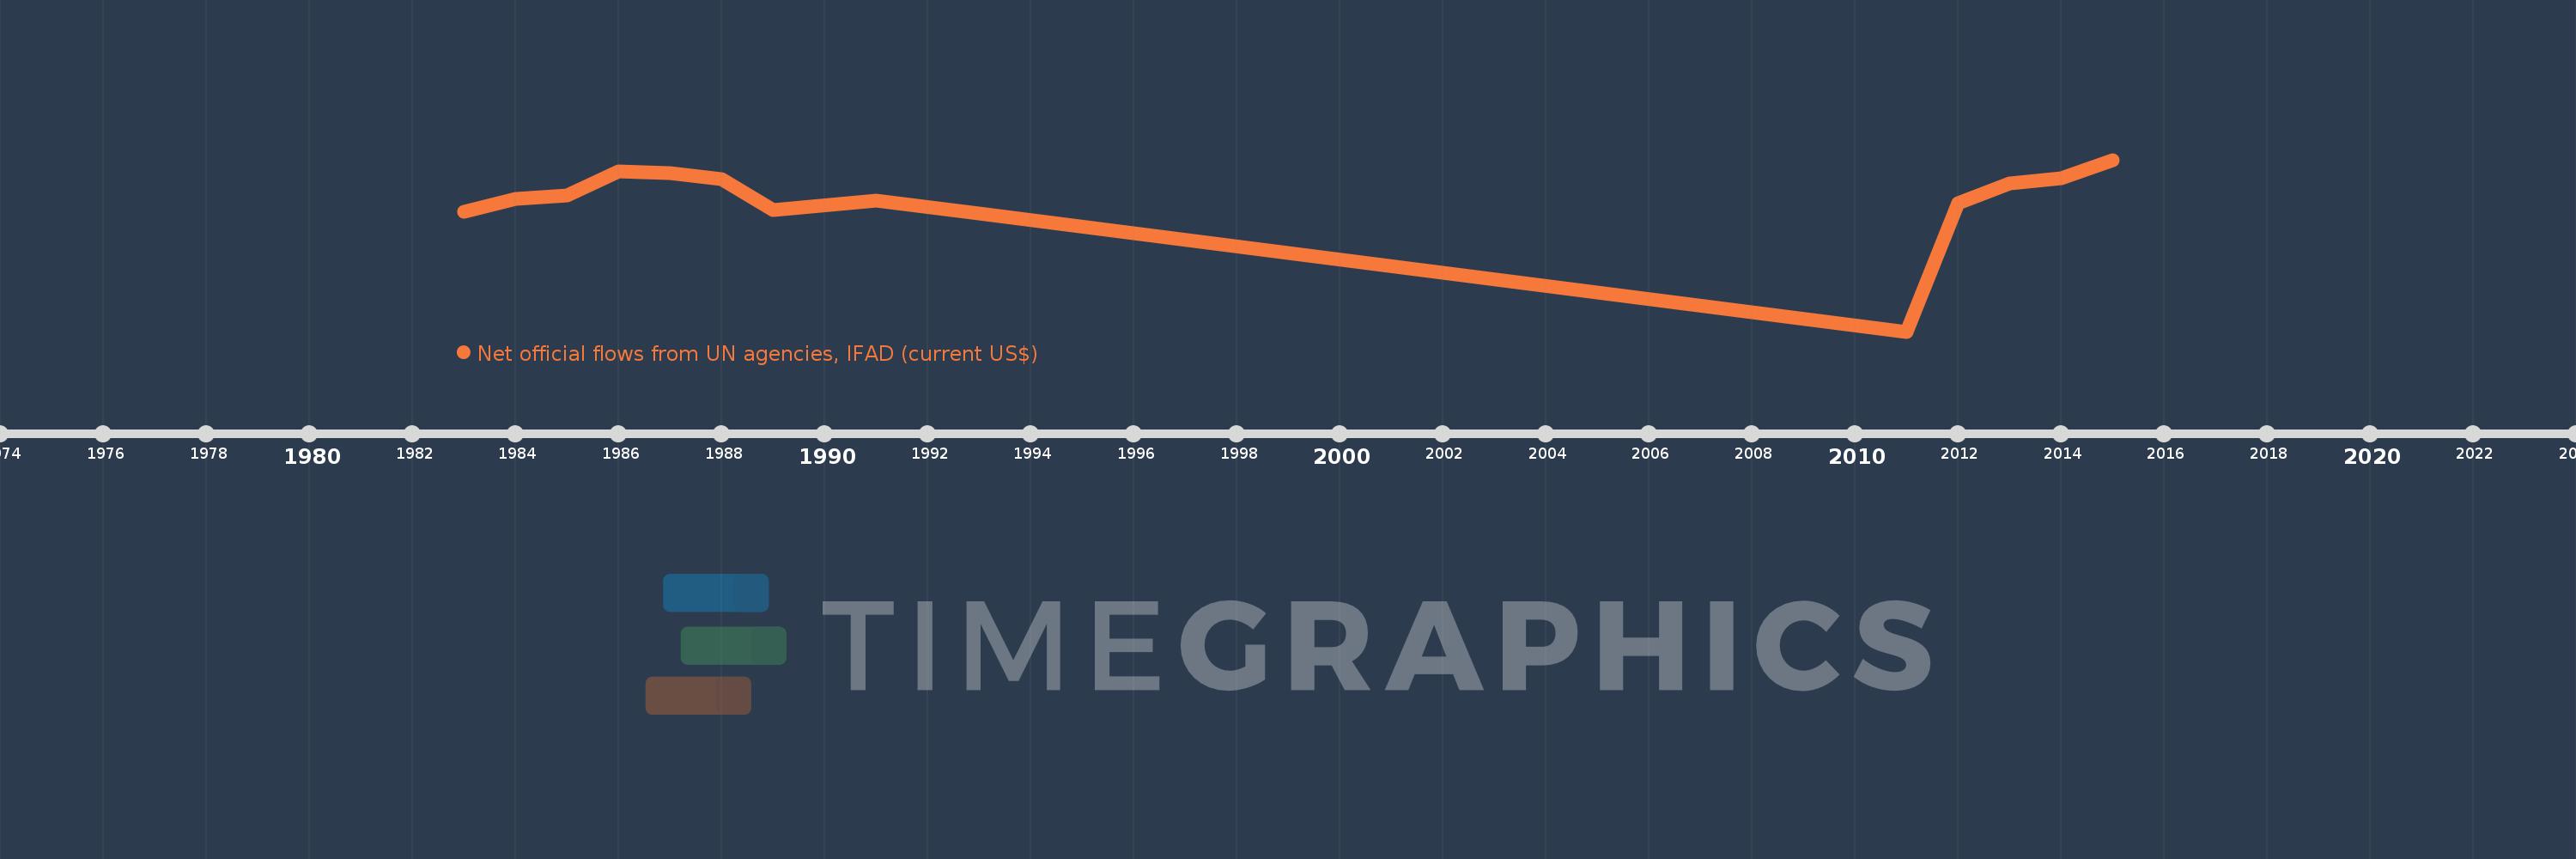
This timeline shows a graph from 1983 to 2015 of Liberia. No data until 1982. Number of actual observations by date: 14.
Source name:
World Development Indicators
Source organization:
Development Assistance Committee of the Organisation for Economic Co-operation and Development, Geographical Distribution of Financial Flows to Developing Countries, Development Co-operation Report, and International Development Statistics database. Data are available online at: www.oecd.org/dac/stats/idsonline.
Categories, topics:
Aid Effectiveness
Last updated:
apr 23, 2017
Indicators value changes by year
Meaning:
1.112 mln
Minimum:
-10.25 mln
jan 1, 2011
Maximum:
4.68 mln
jan 1, 2015
At the date of observation
Value
Absolute change
Change from the previous value
jan 1, 1983
160.0K
+160.0K
0.0%
jan 1, 1984
1.26 mln
+1.1 mln
687.5%
jan 1, 1985
1.57 mln
+310.0K
24.6%
jan 1, 1986
3.67 mln
+2.1 mln
133.76%
jan 1, 1987
3.5 mln
-170.0K
-4.63%
jan 1, 1988
3.0 mln
-500.0K
-14.29%
jan 1, 1989
310.0K
-2.69 mln
-89.67%
jan 1, 1991
1.1 mln
+790.0K
254.84%
jan 1, 1993
0.0
-1.1 mln
-100.0%
jan 1, 2011
-10.25 mln
-10.25 mln
%
jan 1, 2012
910.0K
+11.16 mln
-108.88%
jan 1, 2013
2.6 mln
+1.69 mln
185.71%
jan 1, 2014
3.06 mln
+460.0K
17.69%
jan 1, 2015
4.68 mln
+1.62 mln
52.94%
Ranking of countries by current statistics by years