33
/
AIzaSyAYiBZKx7MnpbEhh9jyipgxe19OcubqV5w
August 1, 2025
282685
Vietnam
VNM
true
2
1
Net official flows from UN agencies, IFAD (current US$)
2015,2014,2013,2012,2011,2010,2009,2008,2007,2006,2005,2004,2003,2002,2001,2000,1999,1998,1997,1996,1995,1994
Download
Global statistics library →Vietnam →

Net official flows from UN agencies, IFAD (current US$)

This statistics in other country:

AfghanistanAlbaniaAlgeriaAngolaArab WorldArgentinaArmeniaAzerbaijanBangladeshBelizeBeninBhutanBoliviaBosnia and HerzegovinaBotswanaBrazilBurkina FasoBurundiCabo VerdeCambodiaCameroonCaribbean small statesCentral African RepublicCentral Europe and the BalticsChadChileChinaColombiaComorosCongo, Dem. Rep.Congo, Rep.Costa RicaCote d'IvoireCubaCyprusDjiboutiDominicaDominican RepublicEast Asia & PacificEast Asia & Pacific (excluding high income)East Asia & Pacific (IDA & IBRD countries)EcuadorEgypt, Arab Rep.El SalvadorEquatorial GuineaEritreaEthiopiaEuro areaEurope & Central AsiaEurope & Central Asia (excluding high income)Europe & Central Asia (IDA & IBRD countries)European UnionFragile and conflict affected situationsGabonGambia, TheGeorgiaGhanaGrenadaGuatemalaGuineaGuinea-BissauGuyanaHaitiHeavily indebted poor countries (HIPC)High incomeHondurasIBRD onlyIDA & IBRD totalIDA blendIDA onlyIDA totalIndiaIndonesiaIraqJamaicaJordanKenyaKorea, Dem. People’s Rep.Kyrgyz RepublicLao PDRLatin America & Caribbean Latin America & Caribbean (excluding high income)Latin America & the Caribbean (IDA & IBRD countries)Least developed countries: UN classificationLebanonLesothoLiberiaLow incomeLower middle incomeMacao SAR, ChinaMacedonia, FYRMadagascarMalawiMaldivesMaliMauritaniaMauritiusMexicoMiddle East & North AfricaMiddle East & North Africa (excluding high income)Middle East & North Africa (IDA & IBRD countries)MoldovaMongoliaMoroccoMozambiqueMyanmarNamibiaNepalNicaraguaNigerNigeriaOECD membersOther small statesPacific island small statesPakistanPanamaPapua New GuineaParaguayPeruPhilippinesRomaniaRwandaSamoaSao Tome and PrincipeSenegalSeychellesSierra LeoneSmall statesSolomon IslandsSomaliaSouth AsiaSouth Asia (IDA & IBRD)South SudanSri LankaSt. LuciaSt. Vincent and the GrenadinesSub-Saharan Africa Sub-Saharan Africa (excluding high income)Sub-Saharan Africa (IDA & IBRD countries)SudanSurinameSwazilandSyrian Arab RepublicTajikistanTanzaniaThailandTimor-LesteTogoTongaTunisiaTurkeyUgandaUpper middle incomeUruguayUzbekistanVenezuela, RBVietnamWest Bank and GazaWorldYemen, Rep.ZambiaZimbabwe

Timeline:

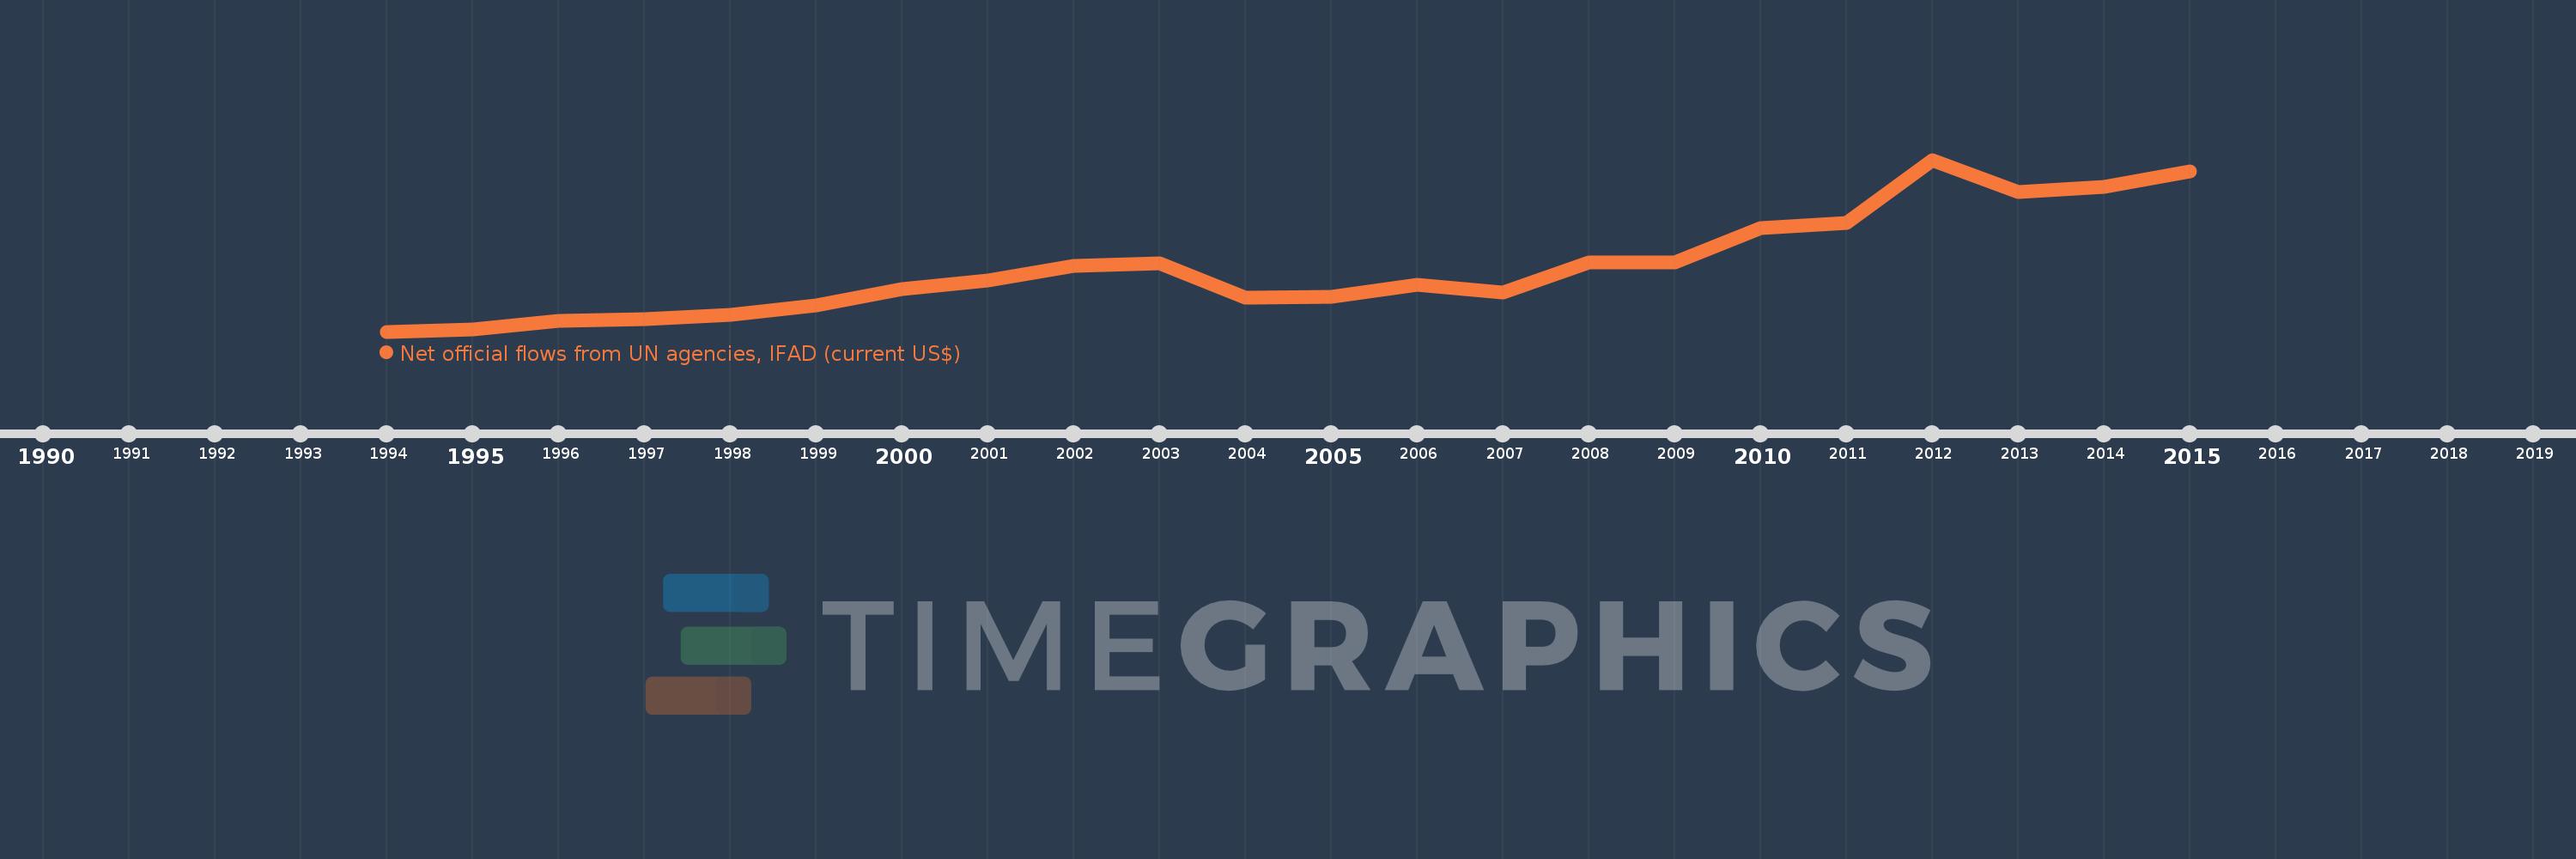
This timeline shows a graph from 1994 to 2015 of Vietnam. No data until 1993. Number of actual observations by date: 22.

Source name:

World Development Indicators

Source organization:

Development Assistance Committee of the Organisation for Economic Co-operation and Development, Geographical Distribution of Financial Flows to Developing Countries, Development Co-operation Report, and International Development Statistics database. Data are available online at: www.oecd.org/dac/stats/idsonline.

Categories, topics:

Aid Effectiveness

Last updated:

apr 23, 2017

Indicators value changes by year

Meaning:
9.504 mln
Minimum:
970.0K
jan 1, 1994
Maximum:
23.72 mln
jan 1, 2012
At the date of observation
Value
Absolute change
Change from the previous value
jan 1, 1994
970.0K
+970.0K
0.0%
jan 1, 1995
1.23 mln
+260.0K
26.8%
jan 1, 1996
2.37 mln
+1.14 mln
92.68%
jan 1, 1997
2.59 mln
+220.0K
9.28%
jan 1, 1998
3.22 mln
+630.0K
24.32%
jan 1, 1999
4.46 mln
+1.24 mln
38.51%
jan 1, 2000
6.61 mln
+2.15 mln
48.21%
jan 1, 2001
7.75 mln
+1.14 mln
17.25%
jan 1, 2002
9.65 mln
+1.9 mln
24.52%
jan 1, 2003
9.99 mln
+340.0K
3.52%
jan 1, 2004
5.47 mln
-4.52 mln
-45.25%
jan 1, 2005
5.62 mln
+150.0K
2.74%
jan 1, 2006
7.2 mln
+1.58 mln
28.11%
jan 1, 2007
6.13 mln
-1.07 mln
-14.86%
jan 1, 2008
10.12 mln
+3.99 mln
65.09%
jan 1, 2009
10.13 mln
+10.0K
0.1%
jan 1, 2010
14.69 mln
+4.56 mln
45.01%
jan 1, 2011
15.39 mln
+700.0K
4.77%
jan 1, 2012
23.72 mln
+8.33 mln
54.13%
jan 1, 2013
19.43 mln
-4.29 mln
-18.09%
jan 1, 2014
20.17 mln
+740.0K
3.81%
jan 1, 2015
22.17 mln
+2.0 mln
9.92%

Ranking of countries by current statistics by years