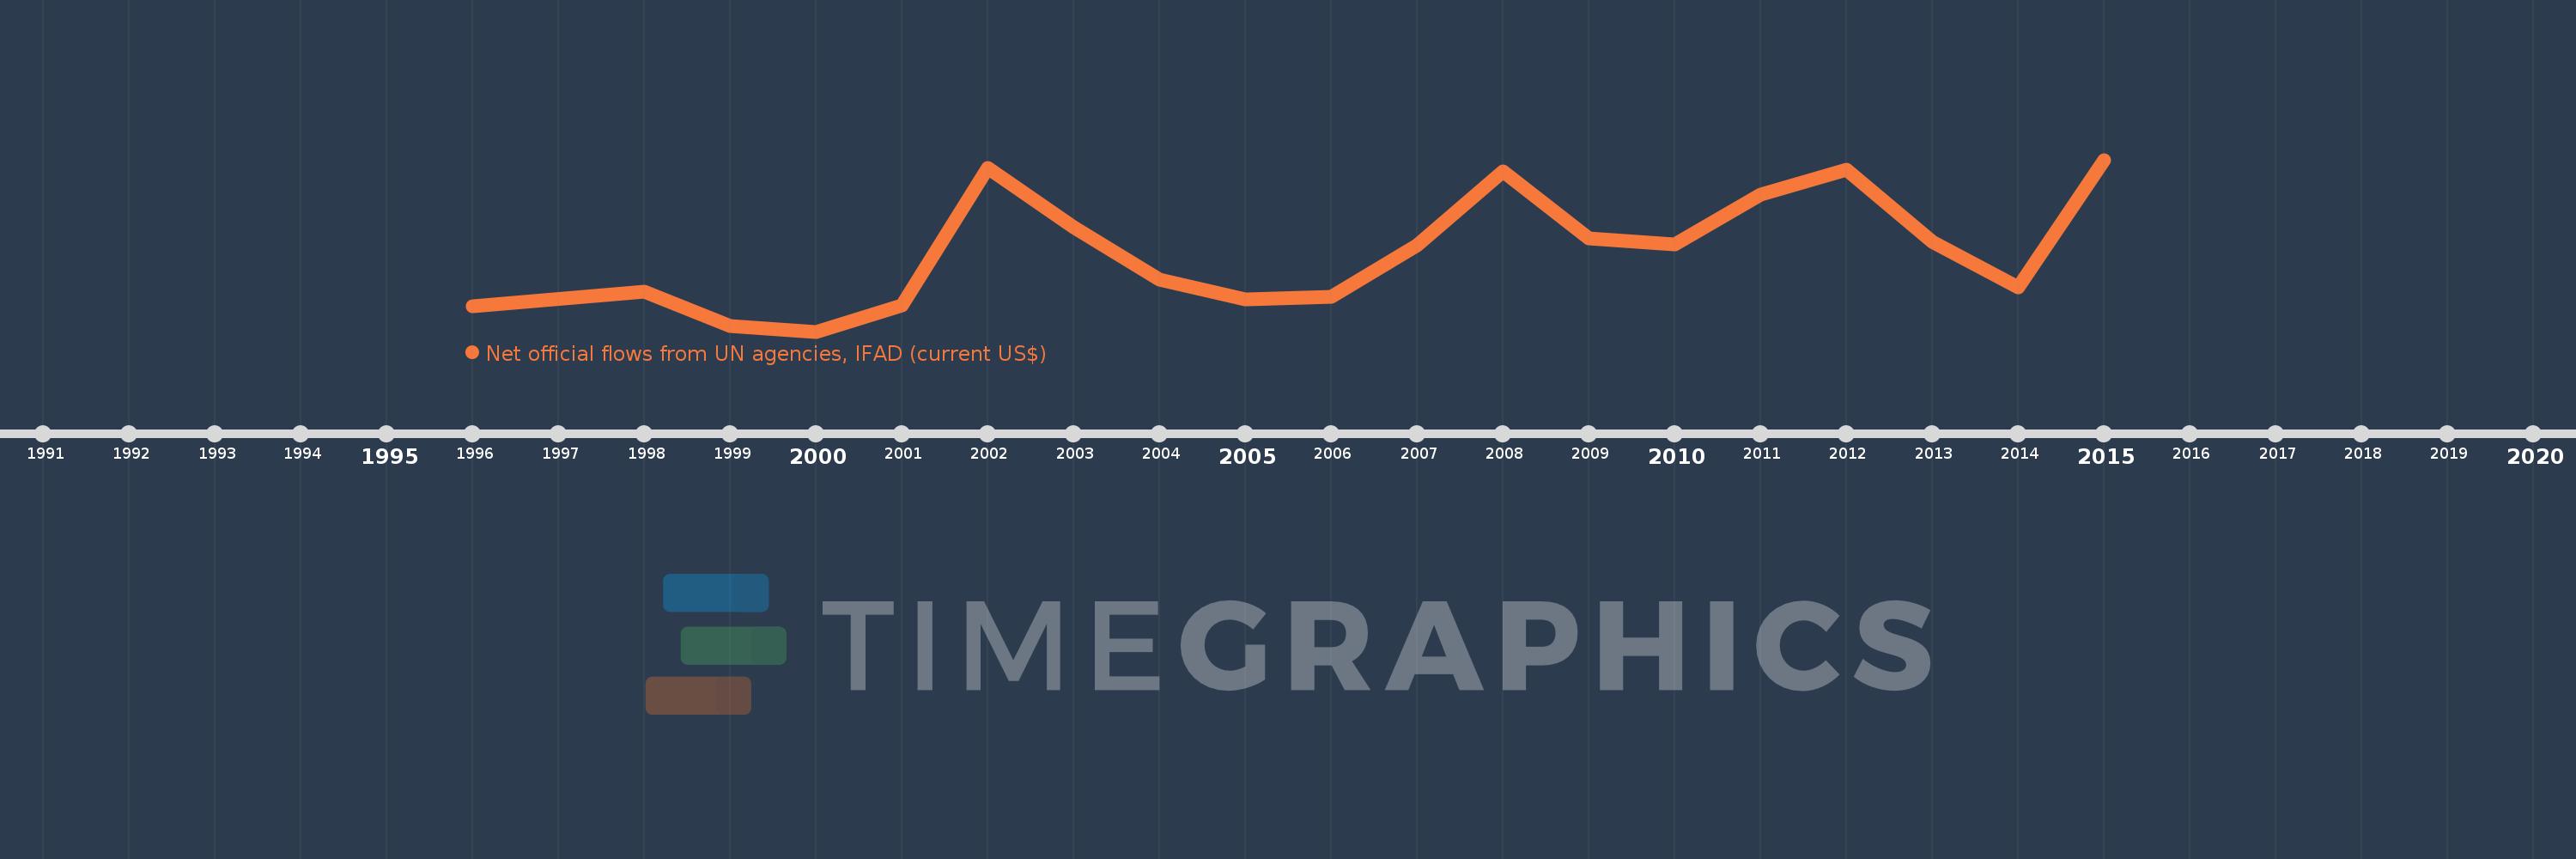
This timeline shows a graph from 1996 to 2015 of Eritrea. No data until 1995. Number of actual observations by date: 19.
Source name:
World Development Indicators
Source organization:
Development Assistance Committee of the Organisation for Economic Co-operation and Development, Geographical Distribution of Financial Flows to Developing Countries, Development Co-operation Report, and International Development Statistics database. Data are available online at: www.oecd.org/dac/stats/idsonline.
Categories, topics:
Aid Effectiveness
Last updated:
apr 23, 2017
Indicators value changes by year
Meaning:
2.193 mln
Minimum:
60.0K
jan 1, 2000
Maximum:
4.65 mln
jan 1, 2015
At the date of observation
Value
Absolute change
Change from the previous value
jan 1, 1996
730.0K
+730.0K
0.0%
jan 1, 1998
1.13 mln
+400.0K
54.79%
jan 1, 1999
210.0K
-920.0K
-81.42%
jan 1, 2000
60.0K
-150.0K
-71.43%
jan 1, 2001
770.0K
+710.0K
1.18K%
jan 1, 2002
4.43 mln
+3.66 mln
475.32%
jan 1, 2003
2.85 mln
-1.58 mln
-35.67%
jan 1, 2004
1.45 mln
-1.4 mln
-49.12%
jan 1, 2005
930.0K
-520.0K
-35.86%
jan 1, 2006
990.0K
+60.0K
6.45%
jan 1, 2007
2.37 mln
+1.38 mln
139.39%
jan 1, 2008
4.35 mln
+1.98 mln
83.54%
jan 1, 2009
2.54 mln
-1.81 mln
-41.61%
jan 1, 2010
2.39 mln
-150.0K
-5.91%
jan 1, 2011
3.73 mln
+1.34 mln
56.07%
jan 1, 2012
4.39 mln
+660.0K
17.69%
jan 1, 2013
2.45 mln
-1.94 mln
-44.19%
jan 1, 2014
1.25 mln
-1.2 mln
-48.98%
jan 1, 2015
4.65 mln
+3.4 mln
272.0%
Ranking of countries by current statistics by years