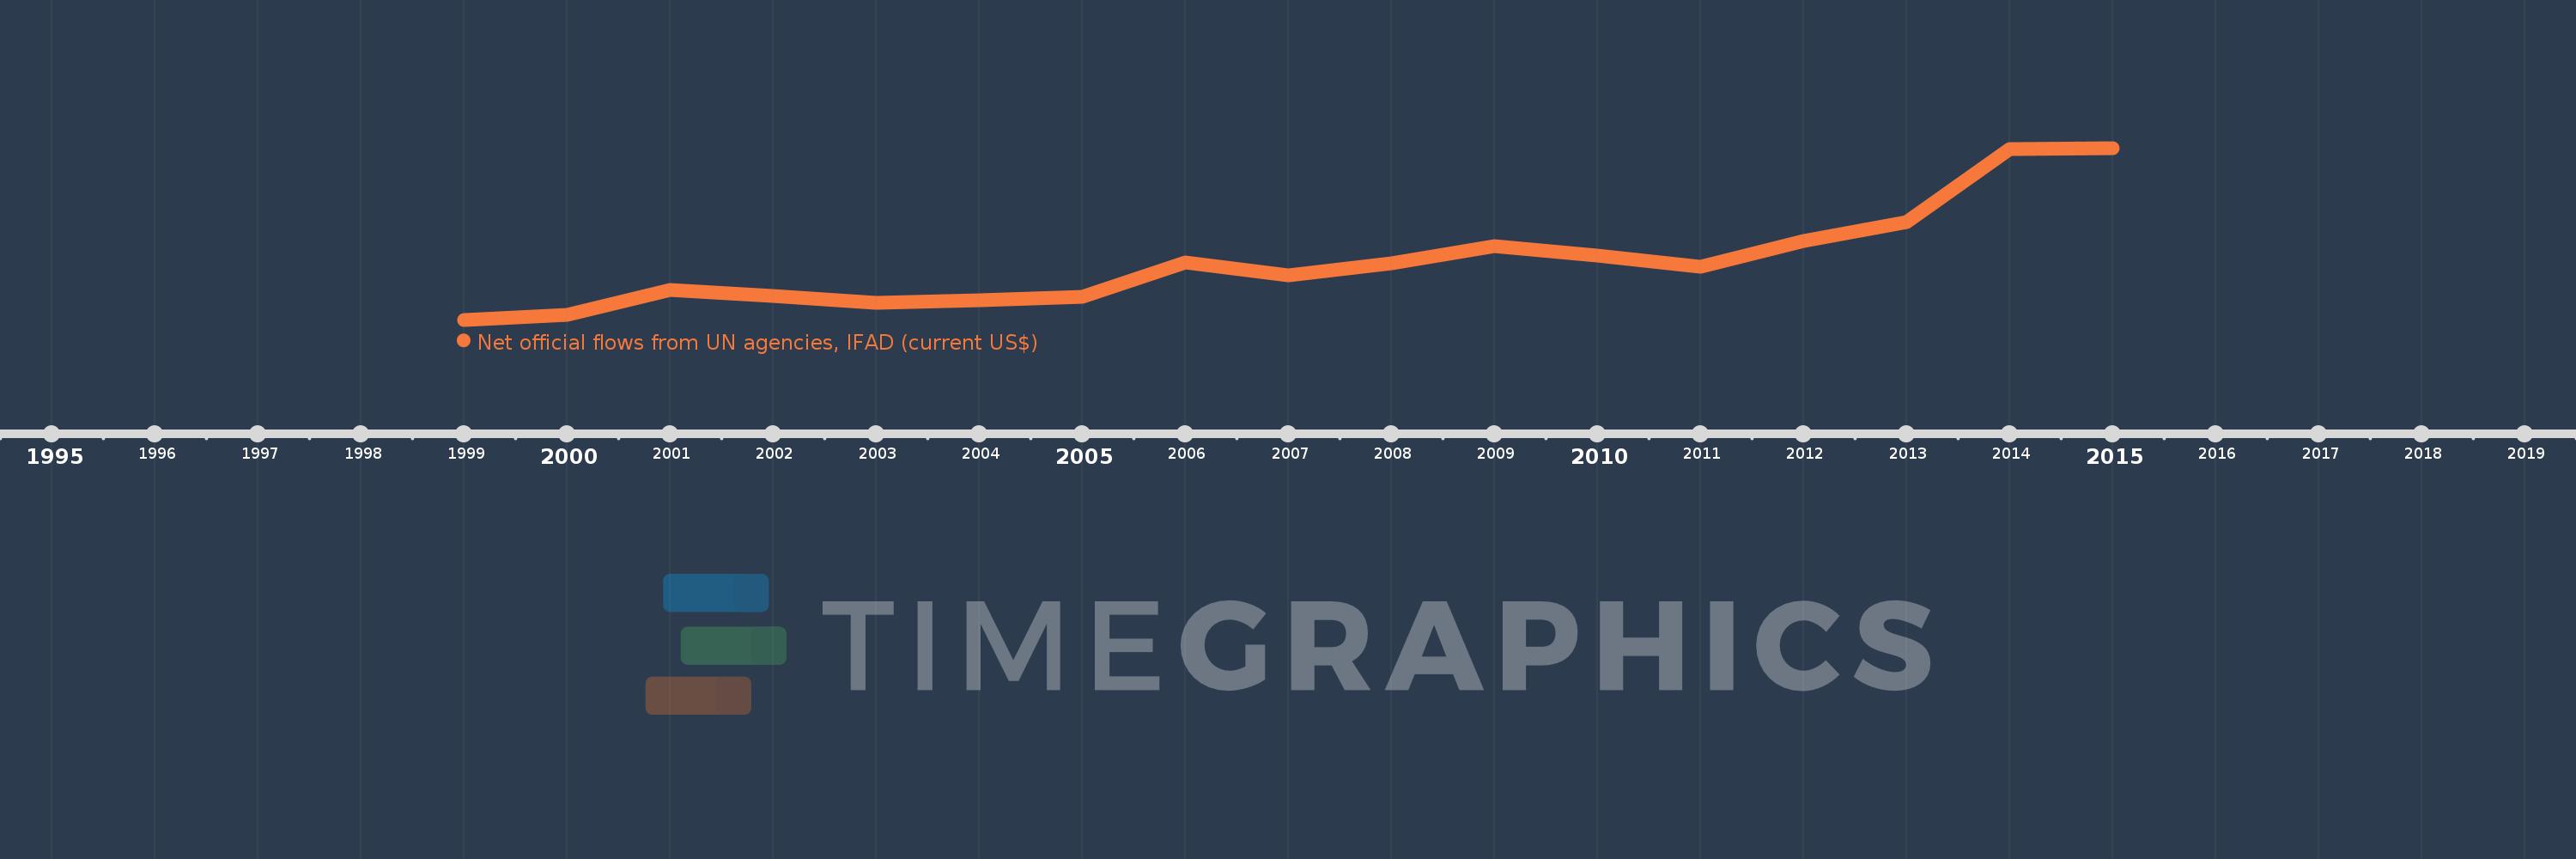
This timeline shows a graph from 1999 to 2015 of Azerbaijan. No data until 1998. Number of actual observations by date: 17.
Source name:
World Development Indicators
Source organization:
Development Assistance Committee of the Organisation for Economic Co-operation and Development, Geographical Distribution of Financial Flows to Developing Countries, Development Co-operation Report, and International Development Statistics database. Data are available online at: www.oecd.org/dac/stats/idsonline.
Categories, topics:
Aid Effectiveness
Last updated:
apr 23, 2017
Indicators value changes by year
Meaning:
3.304 mln
Minimum:
1000.0K
jan 1, 1999
Maximum:
7.83 mln
jan 1, 2015
At the date of observation
Value
Absolute change
Change from the previous value
jan 1, 1999
1000.0K
+1000.0K
0.0%
jan 1, 2000
1.18 mln
+180.0K
18.0%
jan 1, 2001
2.19 mln
+1.01 mln
85.59%
jan 1, 2002
1.95 mln
-240.0K
-10.96%
jan 1, 2003
1.66 mln
-290.0K
-14.87%
jan 1, 2004
1.79 mln
+130.0K
7.83%
jan 1, 2005
1.91 mln
+120.0K
6.7%
jan 1, 2006
3.29 mln
+1.38 mln
72.25%
jan 1, 2007
2.75 mln
-540.0K
-16.41%
jan 1, 2008
3.24 mln
+490.0K
17.82%
jan 1, 2009
3.92 mln
+680.0K
20.99%
jan 1, 2010
3.55 mln
-370.0K
-9.44%
jan 1, 2011
3.1 mln
-450.0K
-12.68%
jan 1, 2012
4.13 mln
+1.03 mln
33.23%
jan 1, 2013
4.87 mln
+740.0K
17.92%
jan 1, 2014
7.8 mln
+2.93 mln
60.16%
jan 1, 2015
7.83 mln
+30.0K
0.38%
Ranking of countries by current statistics by years