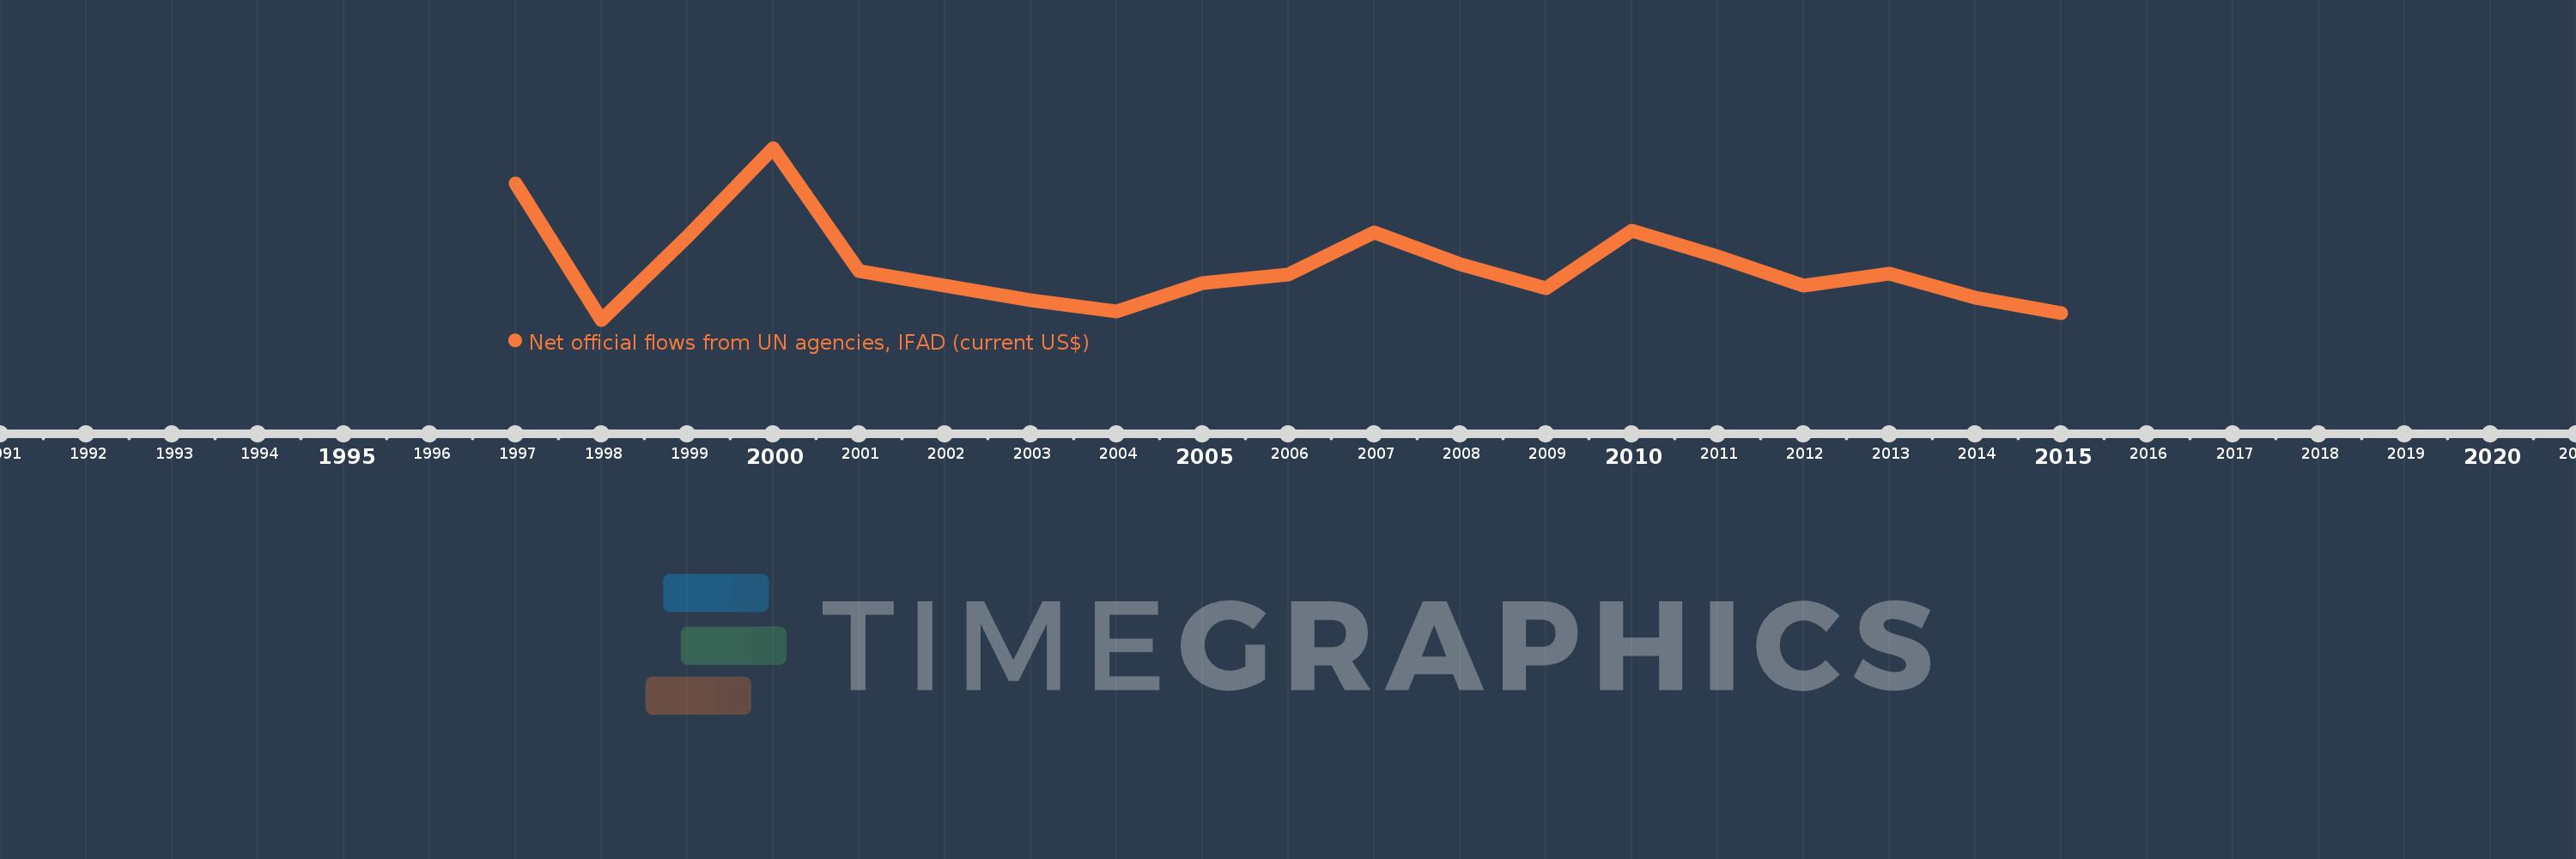
This timeline shows a graph from 1997 to 2015 of Bosnia and Herzegovina. No data until 1996. Number of actual observations by date: 18.
Source name:
World Development Indicators
Source organization:
Development Assistance Committee of the Organisation for Economic Co-operation and Development, Geographical Distribution of Financial Flows to Developing Countries, Development Co-operation Report, and International Development Statistics database. Data are available online at: www.oecd.org/dac/stats/idsonline.
Categories, topics:
Aid Effectiveness
Last updated:
apr 23, 2017
Indicators value changes by year
Meaning:
2.569 mln
Minimum:
250.0K
jan 1, 1998
Maximum:
7.52 mln
jan 1, 2000
At the date of observation
Value
Absolute change
Change from the previous value
jan 1, 1997
6.02 mln
+6.02 mln
0.0%
jan 1, 1998
250.0K
-5.77 mln
-95.85%
jan 1, 1999
3.78 mln
+3.53 mln
1.41K%
jan 1, 2000
7.52 mln
+3.74 mln
98.94%
jan 1, 2001
2.31 mln
-5.21 mln
-69.28%
jan 1, 2003
1.08 mln
-1.23 mln
-53.25%
jan 1, 2004
590.0K
-490.0K
-45.37%
jan 1, 2005
1.82 mln
+1.23 mln
208.47%
jan 1, 2006
2.15 mln
+330.0K
18.13%
jan 1, 2007
3.94 mln
+1.79 mln
83.26%
jan 1, 2008
2.6 mln
-1.34 mln
-34.01%
jan 1, 2009
1.59 mln
-1.01 mln
-38.85%
jan 1, 2010
4.02 mln
+2.43 mln
152.83%
jan 1, 2011
2.93 mln
-1.09 mln
-27.11%
jan 1, 2012
1.69 mln
-1.24 mln
-42.32%
jan 1, 2013
2.21 mln
+520.0K
30.77%
jan 1, 2014
1.2 mln
-1.01 mln
-45.7%
jan 1, 2015
540.0K
-660.0K
-55.0%
Ranking of countries by current statistics by years