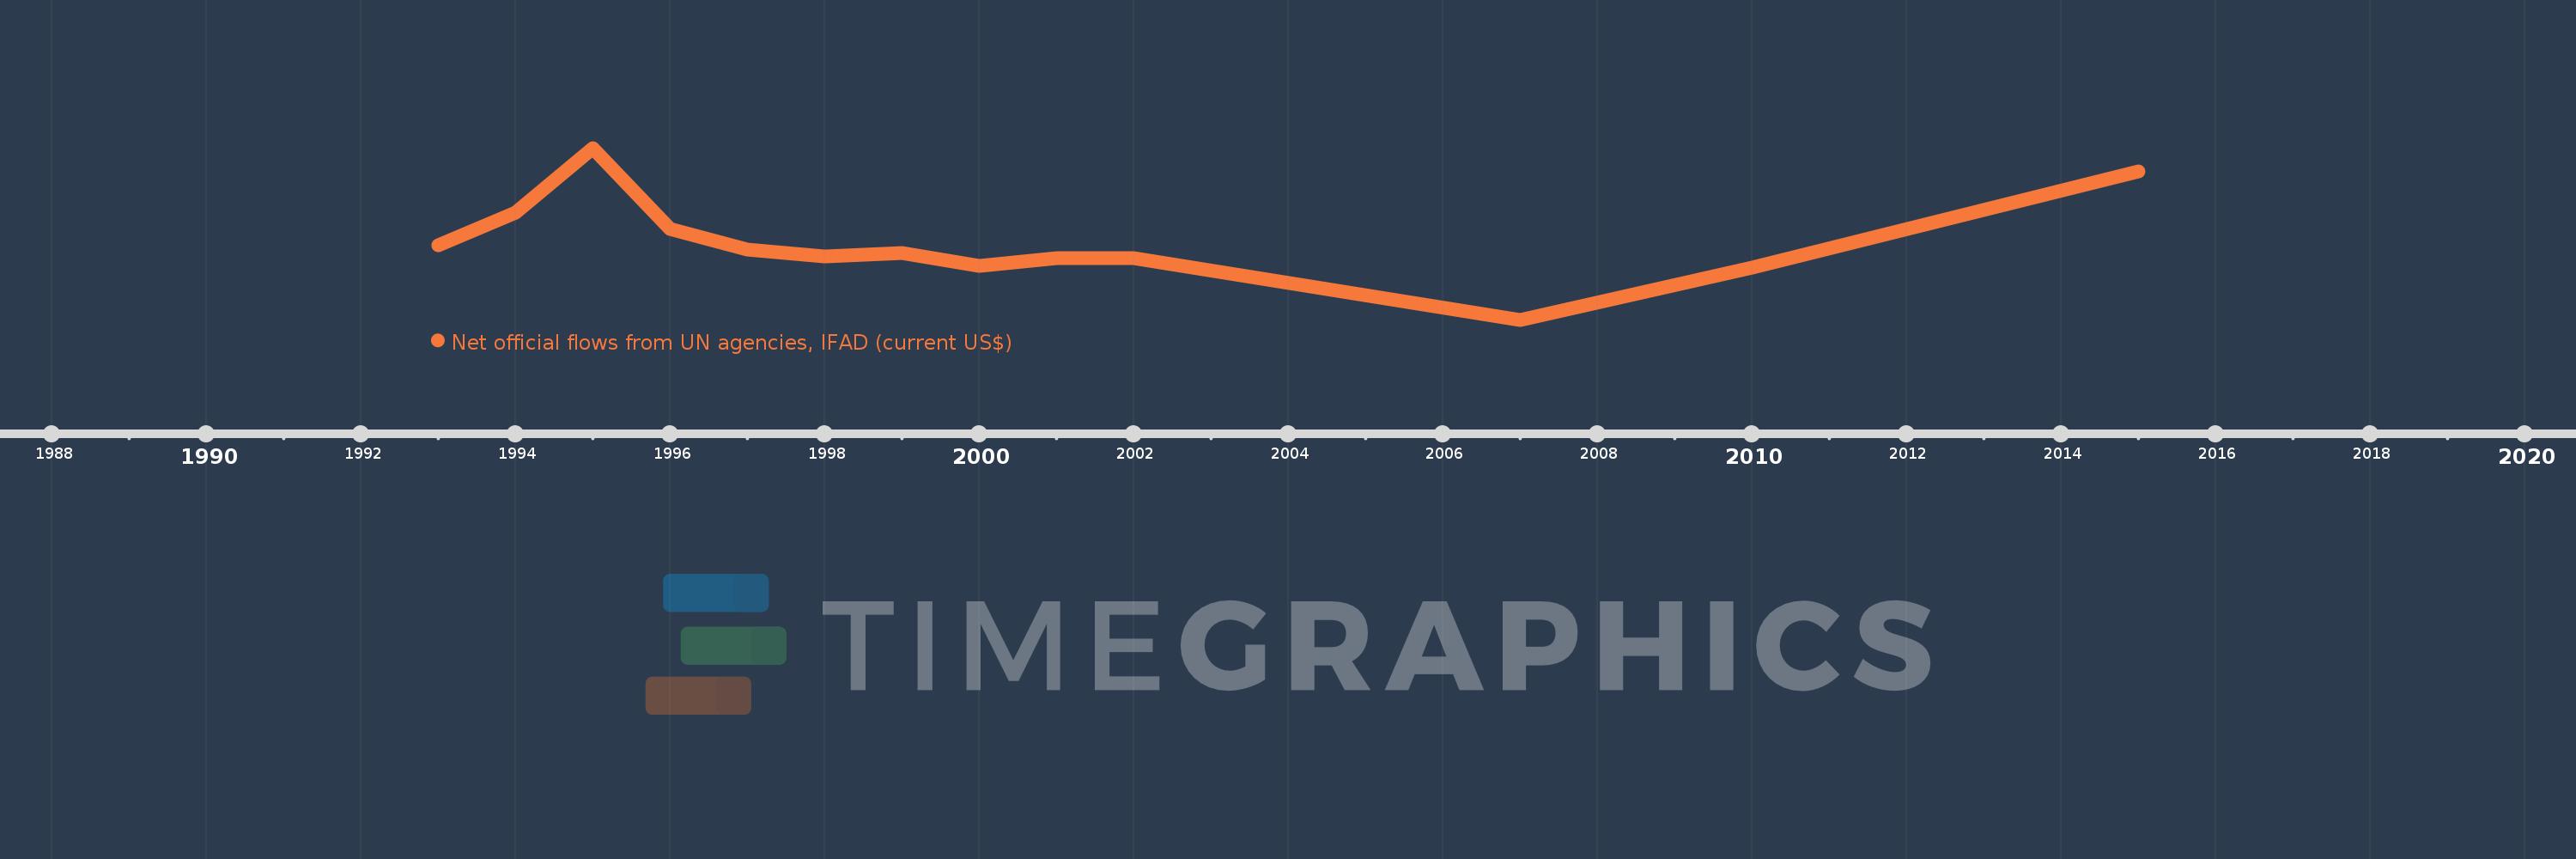
This timeline shows a graph from 1993 to 2015 of Seychelles. No data until 1992. Number of actual observations by date: 13.
Source name:
World Development Indicators
Source organization:
Development Assistance Committee of the Organisation for Economic Co-operation and Development, Geographical Distribution of Financial Flows to Developing Countries, Development Co-operation Report, and International Development Statistics database. Data are available online at: www.oecd.org/dac/stats/idsonline.
Categories, topics:
Aid Effectiveness
Last updated:
apr 23, 2017
Indicators value changes by year
Meaning:
24.615K
Minimum:
-410.0K
jan 1, 2007
Maximum:
540.0K
jan 1, 1995
At the date of observation
Value
Absolute change
Change from the previous value
jan 1, 1993
0.0
0.0
0.0%
jan 1, 1994
180.0K
+180.0K
%
jan 1, 1995
540.0K
+360.0K
200.0%
jan 1, 1996
90.0K
-450.0K
-83.33%
jan 1, 1997
-20.0K
-110.0K
-122.22%
jan 1, 1998
-60.0K
-40.0K
200.0%
jan 1, 1999
-40.0K
+20.0K
-33.33%
jan 1, 2000
-110.0K
-70.0K
175.0%
jan 1, 2001
-70.0K
+40.0K
-36.36%
jan 1, 2002
-70.0K
0.0
0.0%
jan 1, 2007
-410.0K
-340.0K
485.71%
jan 1, 2010
-120.0K
+290.0K
-70.73%
jan 1, 2015
410.0K
+530.0K
-441.67%
Ranking of countries by current statistics by years