33
/
AIzaSyAYiBZKx7MnpbEhh9jyipgxe19OcubqV5w
August 1, 2025
173249
Kyrgyz Republic
KGZ
true
2
1
Net official flows from UN agencies, IFAD (current US$)
2015,2014,2013,2012,2011,2010,2009,2008,2007,2006,2005,2004,2003,2002,2001,2000,1999,1998
Download
Global statistics library →Kyrgyz Republic →

Net official flows from UN agencies, IFAD (current US$)

This statistics in other country:

AfghanistanAlbaniaAlgeriaAngolaArab WorldArgentinaArmeniaAzerbaijanBangladeshBelizeBeninBhutanBoliviaBosnia and HerzegovinaBotswanaBrazilBurkina FasoBurundiCabo VerdeCambodiaCameroonCaribbean small statesCentral African RepublicCentral Europe and the BalticsChadChileChinaColombiaComorosCongo, Dem. Rep.Congo, Rep.Costa RicaCote d'IvoireCubaCyprusDjiboutiDominicaDominican RepublicEast Asia & PacificEast Asia & Pacific (excluding high income)East Asia & Pacific (IDA & IBRD countries)EcuadorEgypt, Arab Rep.El SalvadorEquatorial GuineaEritreaEthiopiaEuro areaEurope & Central AsiaEurope & Central Asia (excluding high income)Europe & Central Asia (IDA & IBRD countries)European UnionFragile and conflict affected situationsGabonGambia, TheGeorgiaGhanaGrenadaGuatemalaGuineaGuinea-BissauGuyanaHaitiHeavily indebted poor countries (HIPC)High incomeHondurasIBRD onlyIDA & IBRD totalIDA blendIDA onlyIDA totalIndiaIndonesiaIraqJamaicaJordanKenyaKorea, Dem. People’s Rep.Kyrgyz RepublicLao PDRLatin America & Caribbean Latin America & Caribbean (excluding high income)Latin America & the Caribbean (IDA & IBRD countries)Least developed countries: UN classificationLebanonLesothoLiberiaLow incomeLower middle incomeMacao SAR, ChinaMacedonia, FYRMadagascarMalawiMaldivesMaliMauritaniaMauritiusMexicoMiddle East & North AfricaMiddle East & North Africa (excluding high income)Middle East & North Africa (IDA & IBRD countries)MoldovaMongoliaMoroccoMozambiqueMyanmarNamibiaNepalNicaraguaNigerNigeriaOECD membersOther small statesPacific island small statesPakistanPanamaPapua New GuineaParaguayPeruPhilippinesRomaniaRwandaSamoaSao Tome and PrincipeSenegalSeychellesSierra LeoneSmall statesSolomon IslandsSomaliaSouth AsiaSouth Asia (IDA & IBRD)South SudanSri LankaSt. LuciaSt. Vincent and the GrenadinesSub-Saharan Africa Sub-Saharan Africa (excluding high income)Sub-Saharan Africa (IDA & IBRD countries)SudanSurinameSwazilandSyrian Arab RepublicTajikistanTanzaniaThailandTimor-LesteTogoTongaTunisiaTurkeyUgandaUpper middle incomeUruguayUzbekistanVenezuela, RBVietnamWest Bank and GazaWorldYemen, Rep.ZambiaZimbabwe

Timeline:

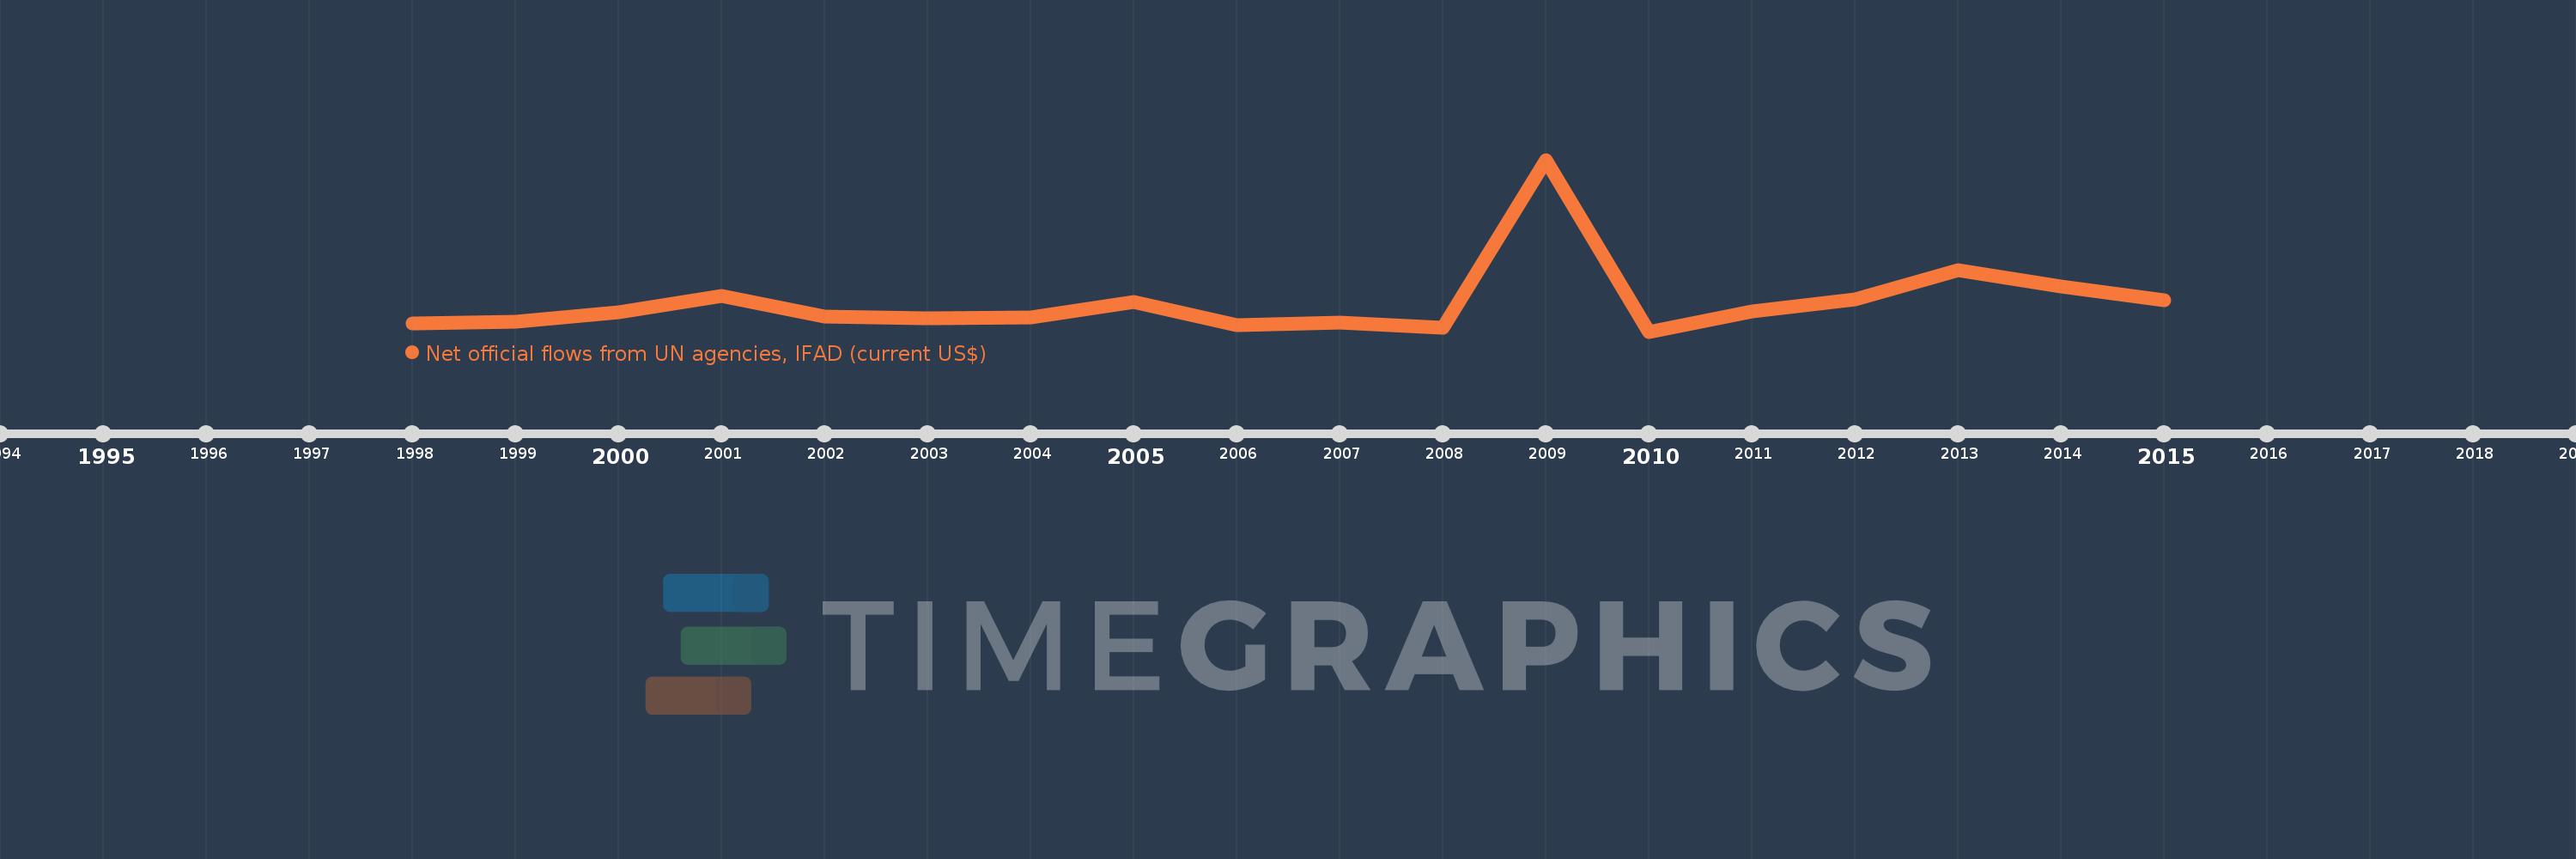
This timeline shows a graph from 1998 to 2015 of Kyrgyz Republic. No data until 1997. Number of actual observations by date: 18.

Source name:

World Development Indicators

Source organization:

Development Assistance Committee of the Organisation for Economic Co-operation and Development, Geographical Distribution of Financial Flows to Developing Countries, Development Co-operation Report, and International Development Statistics database. Data are available online at: www.oecd.org/dac/stats/idsonline.

Categories, topics:

Aid Effectiveness

Last updated:

apr 23, 2017

Indicators value changes by year

Meaning:
1.575 mln
Minimum:
130.0K
jan 1, 2010
Maximum:
8.61 mln
jan 1, 2009
At the date of observation
Value
Absolute change
Change from the previous value
jan 1, 1998
540.0K
+540.0K
0.0%
jan 1, 1999
620.0K
+80.0K
14.81%
jan 1, 2000
1.07 mln
+450.0K
72.58%
jan 1, 2001
1.9 mln
+830.0K
77.57%
jan 1, 2002
870.0K
-1.03 mln
-54.21%
jan 1, 2003
800.0K
-70.0K
-8.05%
jan 1, 2004
820.0K
+20.0K
2.5%
jan 1, 2005
1.61 mln
+790.0K
96.34%
jan 1, 2006
440.0K
-1.17 mln
-72.67%
jan 1, 2007
580.0K
+140.0K
31.82%
jan 1, 2008
330.0K
-250.0K
-43.1%
jan 1, 2009
8.61 mln
+8.28 mln
2.51K%
jan 1, 2010
130.0K
-8.48 mln
-98.49%
jan 1, 2011
1.11 mln
+980.0K
753.85%
jan 1, 2012
1.72 mln
+610.0K
54.95%
jan 1, 2013
3.17 mln
+1.45 mln
84.3%
jan 1, 2014
2.34 mln
-830.0K
-26.18%
jan 1, 2015
1.69 mln
-650.0K
-27.78%

Ranking of countries by current statistics by years