29
/
en
AIzaSyAYiBZKx7MnpbEhh9jyipgxe19OcubqV5w
April 1, 2024
199547
Mongolia
MNG
true
2
1
Net official flows from UN agencies, IFAD (current US$)
2015,2014,2013,2012,2011,2010,2009,2008,2007,2006,2005,2004,2003,2002,2001,2000,1999,1998
Download
Global statistics library →Mongolia →

Net official flows from UN agencies, IFAD (current US$)

This statistics in other country:
AfghanistanAlbaniaAlgeriaAngolaArab WorldArgentinaArmeniaAzerbaijanBangladeshBelizeBeninBhutanBoliviaBosnia and HerzegovinaBotswanaBrazilBurkina FasoBurundiCabo VerdeCambodiaCameroonCaribbean small statesCentral African RepublicCentral Europe and the BalticsChadChileChinaColombiaComorosCongo, Dem. Rep.Congo, Rep.Costa RicaCote d'IvoireCubaCyprusDjiboutiDominicaDominican RepublicEast Asia & PacificEast Asia & Pacific (excluding high income)East Asia & Pacific (IDA & IBRD countries)EcuadorEgypt, Arab Rep.El SalvadorEquatorial GuineaEritreaEthiopiaEuro areaEurope & Central AsiaEurope & Central Asia (excluding high income)Europe & Central Asia (IDA & IBRD countries)European UnionFragile and conflict affected situationsGabonGambia, TheGeorgiaGhanaGrenadaGuatemalaGuineaGuinea-BissauGuyanaHaitiHeavily indebted poor countries (HIPC)High incomeHondurasIBRD onlyIDA & IBRD totalIDA blendIDA onlyIDA totalIndiaIndonesiaIraqJamaicaJordanKenyaKorea, Dem. People’s Rep.Kyrgyz RepublicLao PDRLatin America & Caribbean Latin America & Caribbean (excluding high income)Latin America & the Caribbean (IDA & IBRD countries)Least developed countries: UN classificationLebanonLesothoLiberiaLow incomeLower middle incomeMacao SAR, ChinaMacedonia, FYRMadagascarMalawiMaldivesMaliMauritaniaMauritiusMexicoMiddle East & North AfricaMiddle East & North Africa (excluding high income)Middle East & North Africa (IDA & IBRD countries)MoldovaMongoliaMoroccoMozambiqueMyanmarNamibiaNepalNicaraguaNigerNigeriaOECD membersOther small statesPacific island small statesPakistanPanamaPapua New GuineaParaguayPeruPhilippinesRomaniaRwandaSamoaSao Tome and PrincipeSenegalSeychellesSierra LeoneSmall statesSolomon IslandsSomaliaSouth AsiaSouth Asia (IDA & IBRD)South SudanSri LankaSt. LuciaSt. Vincent and the GrenadinesSub-Saharan Africa Sub-Saharan Africa (excluding high income)Sub-Saharan Africa (IDA & IBRD countries)SudanSurinameSwazilandSyrian Arab RepublicTajikistanTanzaniaThailandTimor-LesteTogoTongaTunisiaTurkeyUgandaUpper middle incomeUruguayUzbekistanVenezuela, RBVietnamWest Bank and GazaWorldYemen, Rep.ZambiaZimbabwe
Timeline:
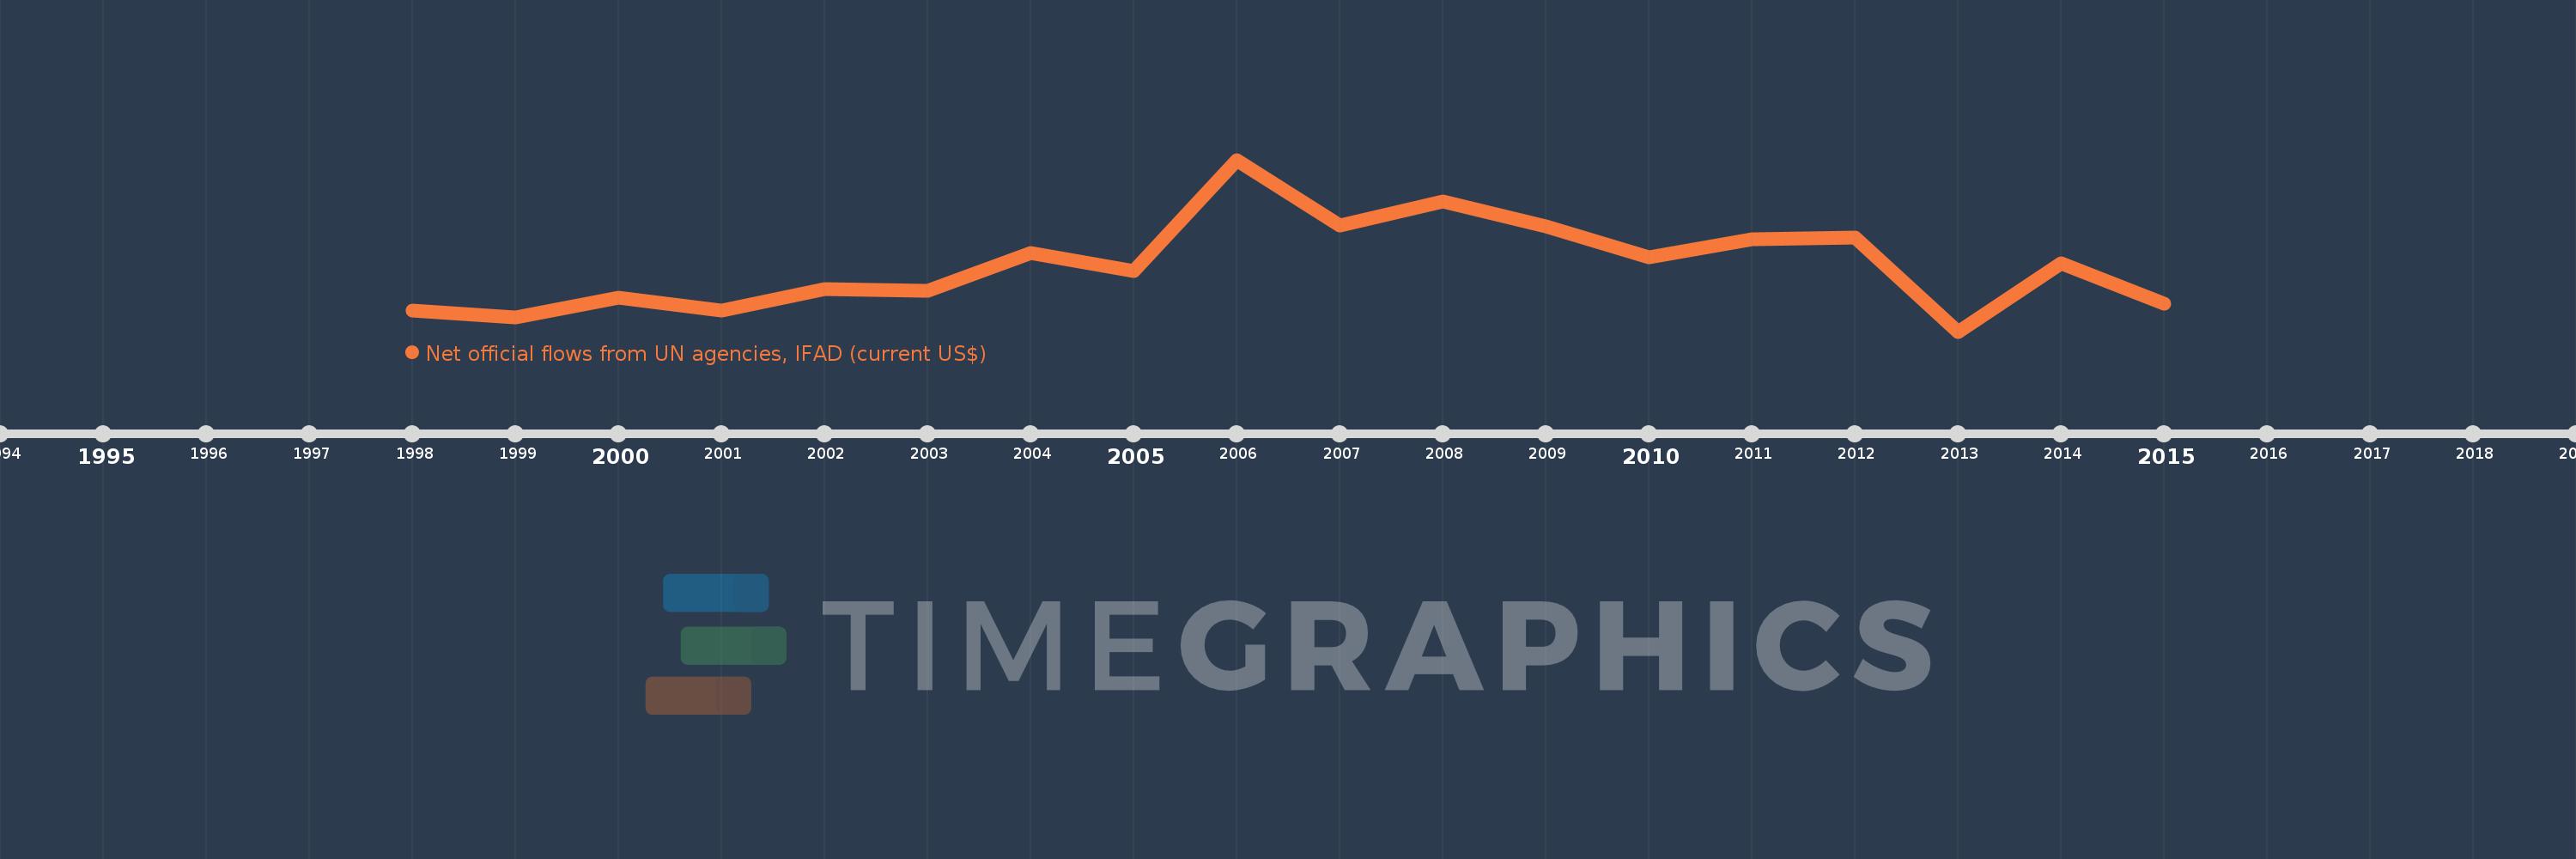
This timeline shows a graph from 1998 to 2015 of Mongolia. No data until 1997. Number of actual observations by date: 18.
Source name:
World Development Indicators
Source organization:
Development Assistance Committee of the Organisation for Economic Co-operation and Development, Geographical Distribution of Financial Flows to Developing Countries, Development Co-operation Report, and International Development Statistics database. Data are available online at: www.oecd.org/dac/stats/idsonline.
Categories, topics:
Aid Effectiveness
Last updated:
apr 23, 2017
Indicators value changes by year
Mean:
1.234 mln
Minimum:
-130.0K
jan 1, 2013
Maximum:
3.44 mln
jan 1, 2006
At the date of observation
Value
Absolute change
Change from previous value
jan 1, 1998
300.0K
+300.0K
0.0%
jan 1, 1999
170.0K
-130.0K
-43.33%
jan 1, 2000
570.0K
+400.0K
235.29%
jan 1, 2001
300.0K
-270.0K
-47.37%
jan 1, 2002
750.0K
+450.0K
150.0%
jan 1, 2003
710.0K
-40.0K
-5.33%
jan 1, 2004
1.5 mln
+790.0K
111.27%
jan 1, 2005
1.12 mln
-380.0K
-25.33%
jan 1, 2006
3.44 mln
+2.32 mln
207.14%
jan 1, 2007
2.08 mln
-1.36 mln
-39.53%
jan 1, 2008
2.58 mln
+500.0K
24.04%
jan 1, 2009
2.06 mln
-520.0K
-20.16%
jan 1, 2010
1.42 mln
-640.0K
-31.07%
jan 1, 2011
1.78 mln
+360.0K
25.35%
jan 1, 2012
1.82 mln
+40.0K
2.25%
jan 1, 2013
-130.0K
-1.95 mln
-107.14%
jan 1, 2014
1.29 mln
+1.42 mln
-1.09K%
jan 1, 2015
450.0K
-840.0K
-65.12%
Ranking of countries by current statistics by years

Comments:

Send
PremiumAbout & FeedbackTermsPrivacy
logo
© 2022 Selected Technologies LLC – Morgan Hill, California