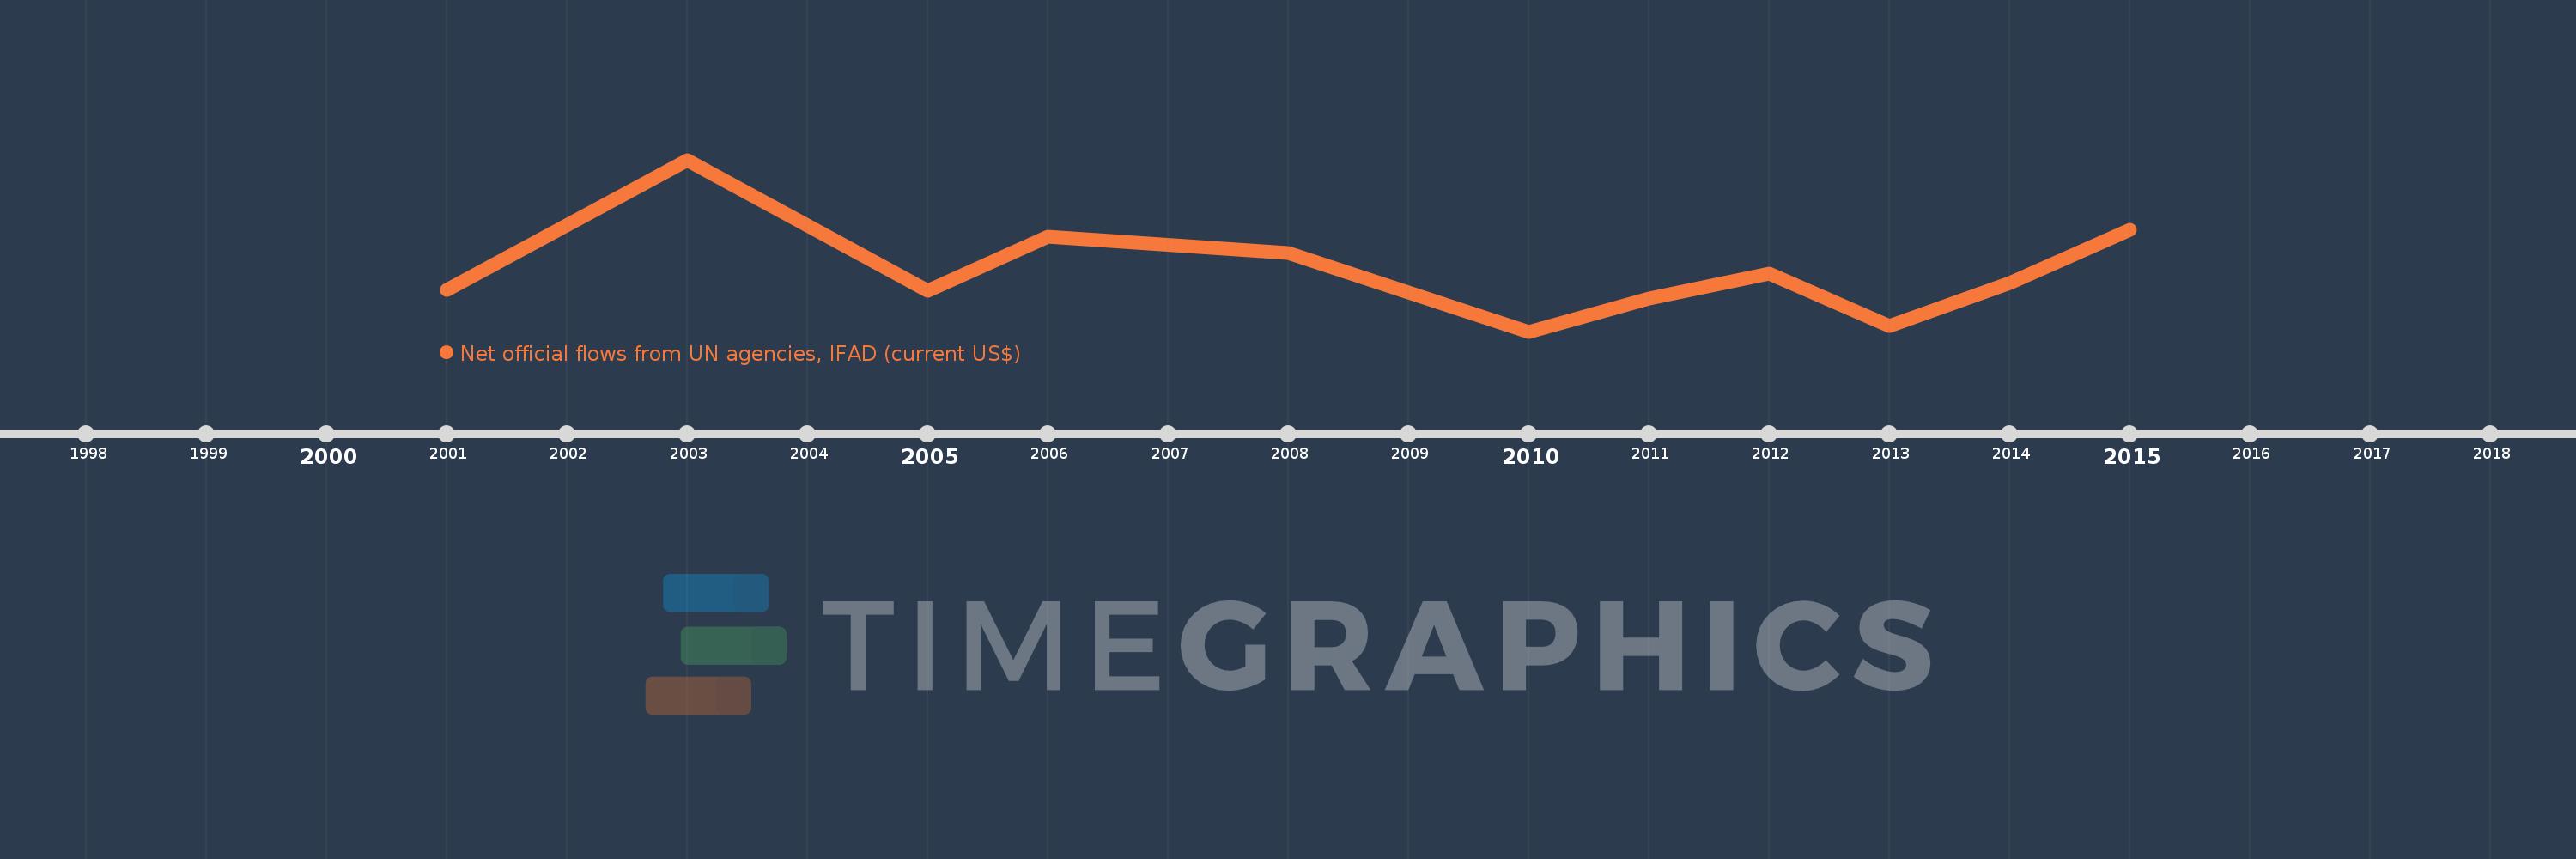
This timeline shows a graph from 2001 to 2015 of West Bank and Gaza. No data until 2000. Number of actual observations by date: 11.
Source name:
World Development Indicators
Source organization:
Development Assistance Committee of the Organisation for Economic Co-operation and Development, Geographical Distribution of Financial Flows to Developing Countries, Development Co-operation Report, and International Development Statistics database. Data are available online at: www.oecd.org/dac/stats/idsonline.
Categories, topics:
Aid Effectiveness
Last updated:
apr 23, 2017
Indicators value changes by year
Meaning:
867.273K
Minimum:
-290.0K
jan 1, 2010
Maximum:
2.95 mln
jan 1, 2003
At the date of observation
Value
Absolute change
Change from the previous value
jan 1, 2001
500.0K
+500.0K
0.0%
jan 1, 2003
2.95 mln
+2.45 mln
490.0%
jan 1, 2005
480.0K
-2.47 mln
-83.73%
jan 1, 2006
1.5 mln
+1.02 mln
212.5%
jan 1, 2008
1.19 mln
-310.0K
-20.67%
jan 1, 2010
-290.0K
-1.48 mln
-124.37%
jan 1, 2011
330.0K
+620.0K
-213.79%
jan 1, 2012
810.0K
+480.0K
145.45%
jan 1, 2013
-190.0K
-1000.0K
-123.46%
jan 1, 2014
630.0K
+820.0K
-431.58%
jan 1, 2015
1.63 mln
+1000.0K
158.73%
Ranking of countries by current statistics by years