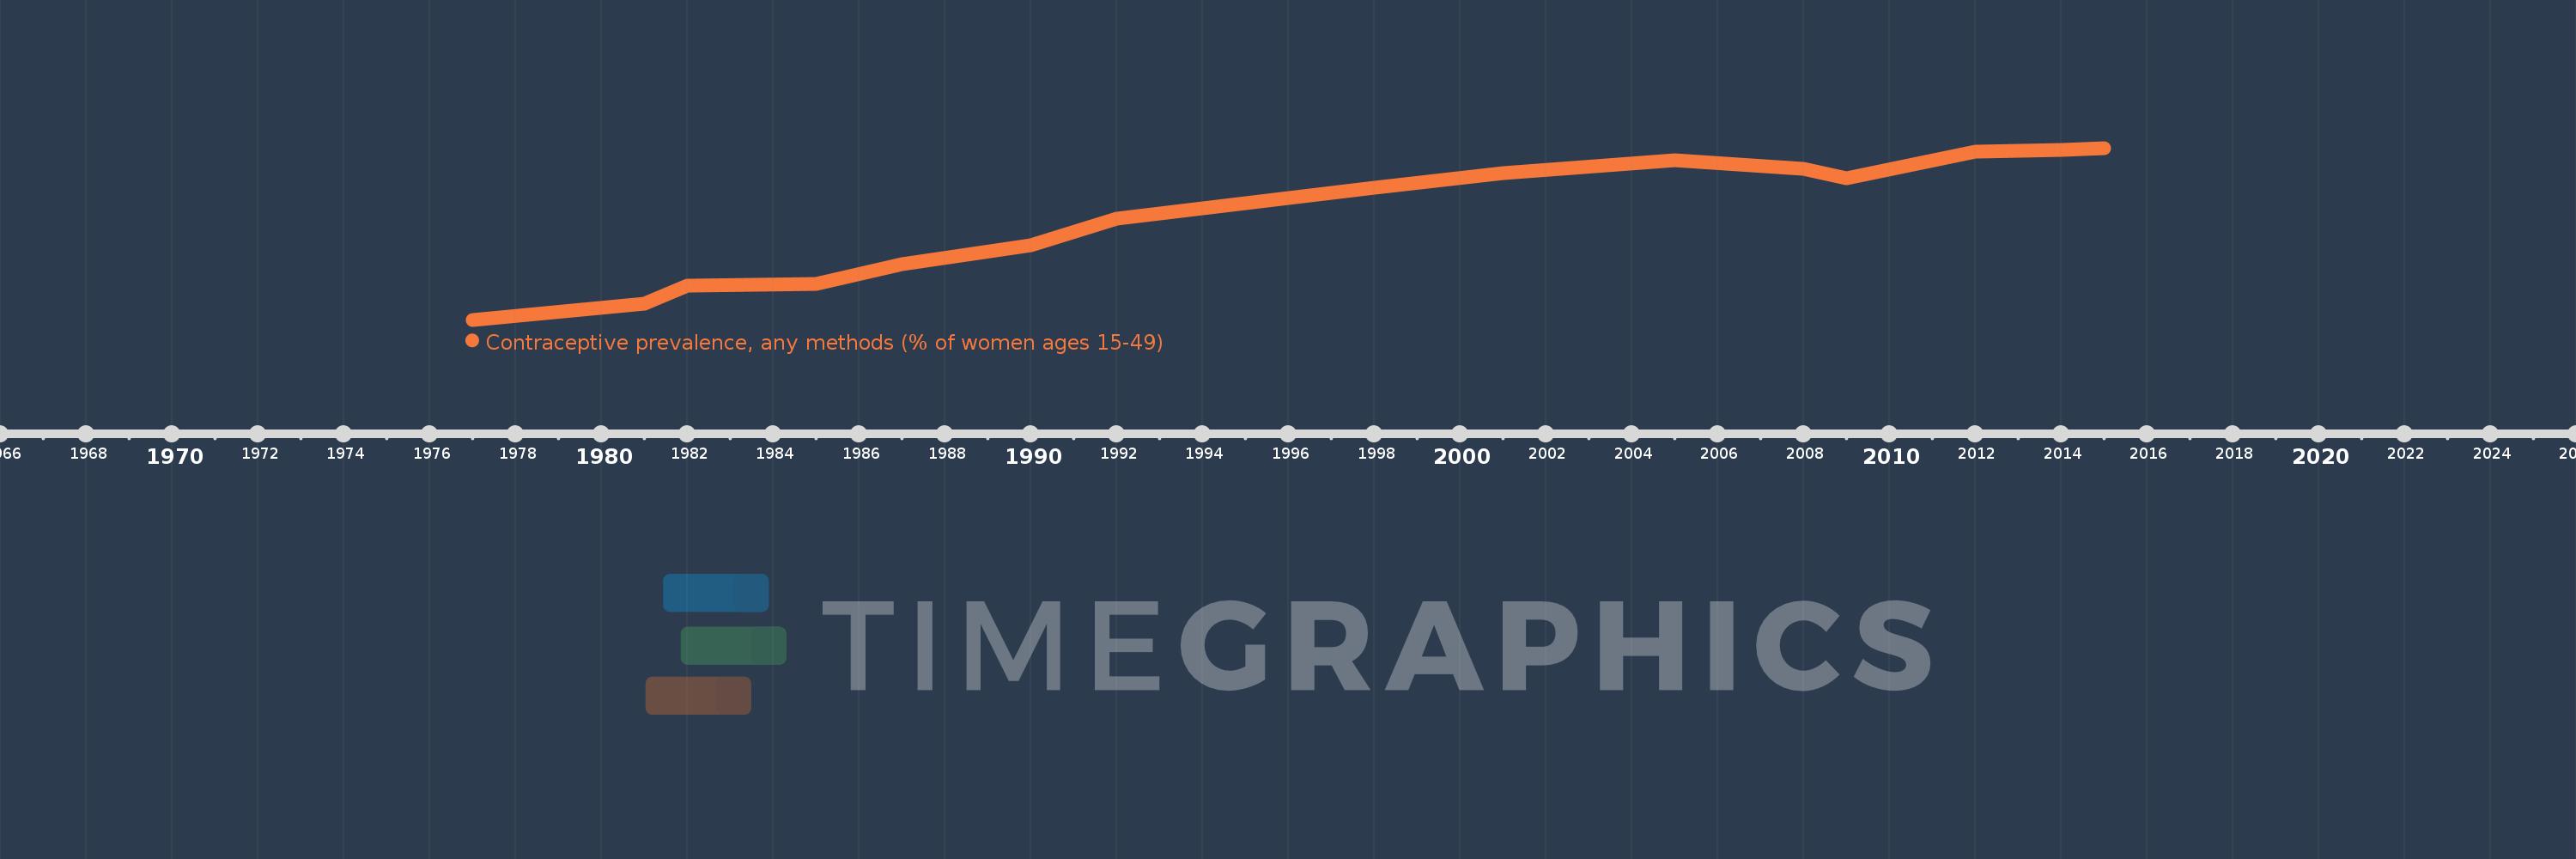
This timeline shows a graph from 1977 to 2015 of Bangladesh. No data until 1976. Number of actual observations by date: 16.
Source name:
World Development Indicators
Source organization:
UNICEF's State of the World's Children and Childinfo, United Nations Population Division's World Contraceptive Use, household surveys including Demographic and Health Surveys and Multiple Indicator Cluster Surveys.
Categories, topics:
Health, Gender
Last updated:
apr 23, 2017
Indicators value changes by year
Meaning:
41.002
Minimum:
7.7
jan 1, 1977
Maximum:
62.4
jan 1, 2015
At the date of observation
Value
Absolute change
Change from the previous value
jan 1, 1977
7.7
+7.7
0.0%
jan 1, 1981
12.7
+5.0
64.94%
jan 1, 1982
18.6
+5.9
46.46%
jan 1, 1985
19.1
+0.5
2.69%
jan 1, 1987
25.3
+6.2
32.46%
jan 1, 1990
31.4
+6.1
24.11%
jan 1, 1992
39.9
+8.5
27.07%
jan 1, 1995
44.9
+5.0
12.53%
jan 1, 1998
49.8
+4.9
10.91%
jan 1, 2001
54.3
+4.5
9.04%
jan 1, 2005
58.5
+4.2
7.73%
jan 1, 2008
55.8
-2.7
-4.62%
jan 1, 2009
52.64
-3.16
-5.66%
jan 1, 2012
61.2
+8.56
16.26%
jan 1, 2014
61.8
+0.6
0.98%
jan 1, 2015
62.4
+0.6
0.97%
Ranking of countries by current statistics by years