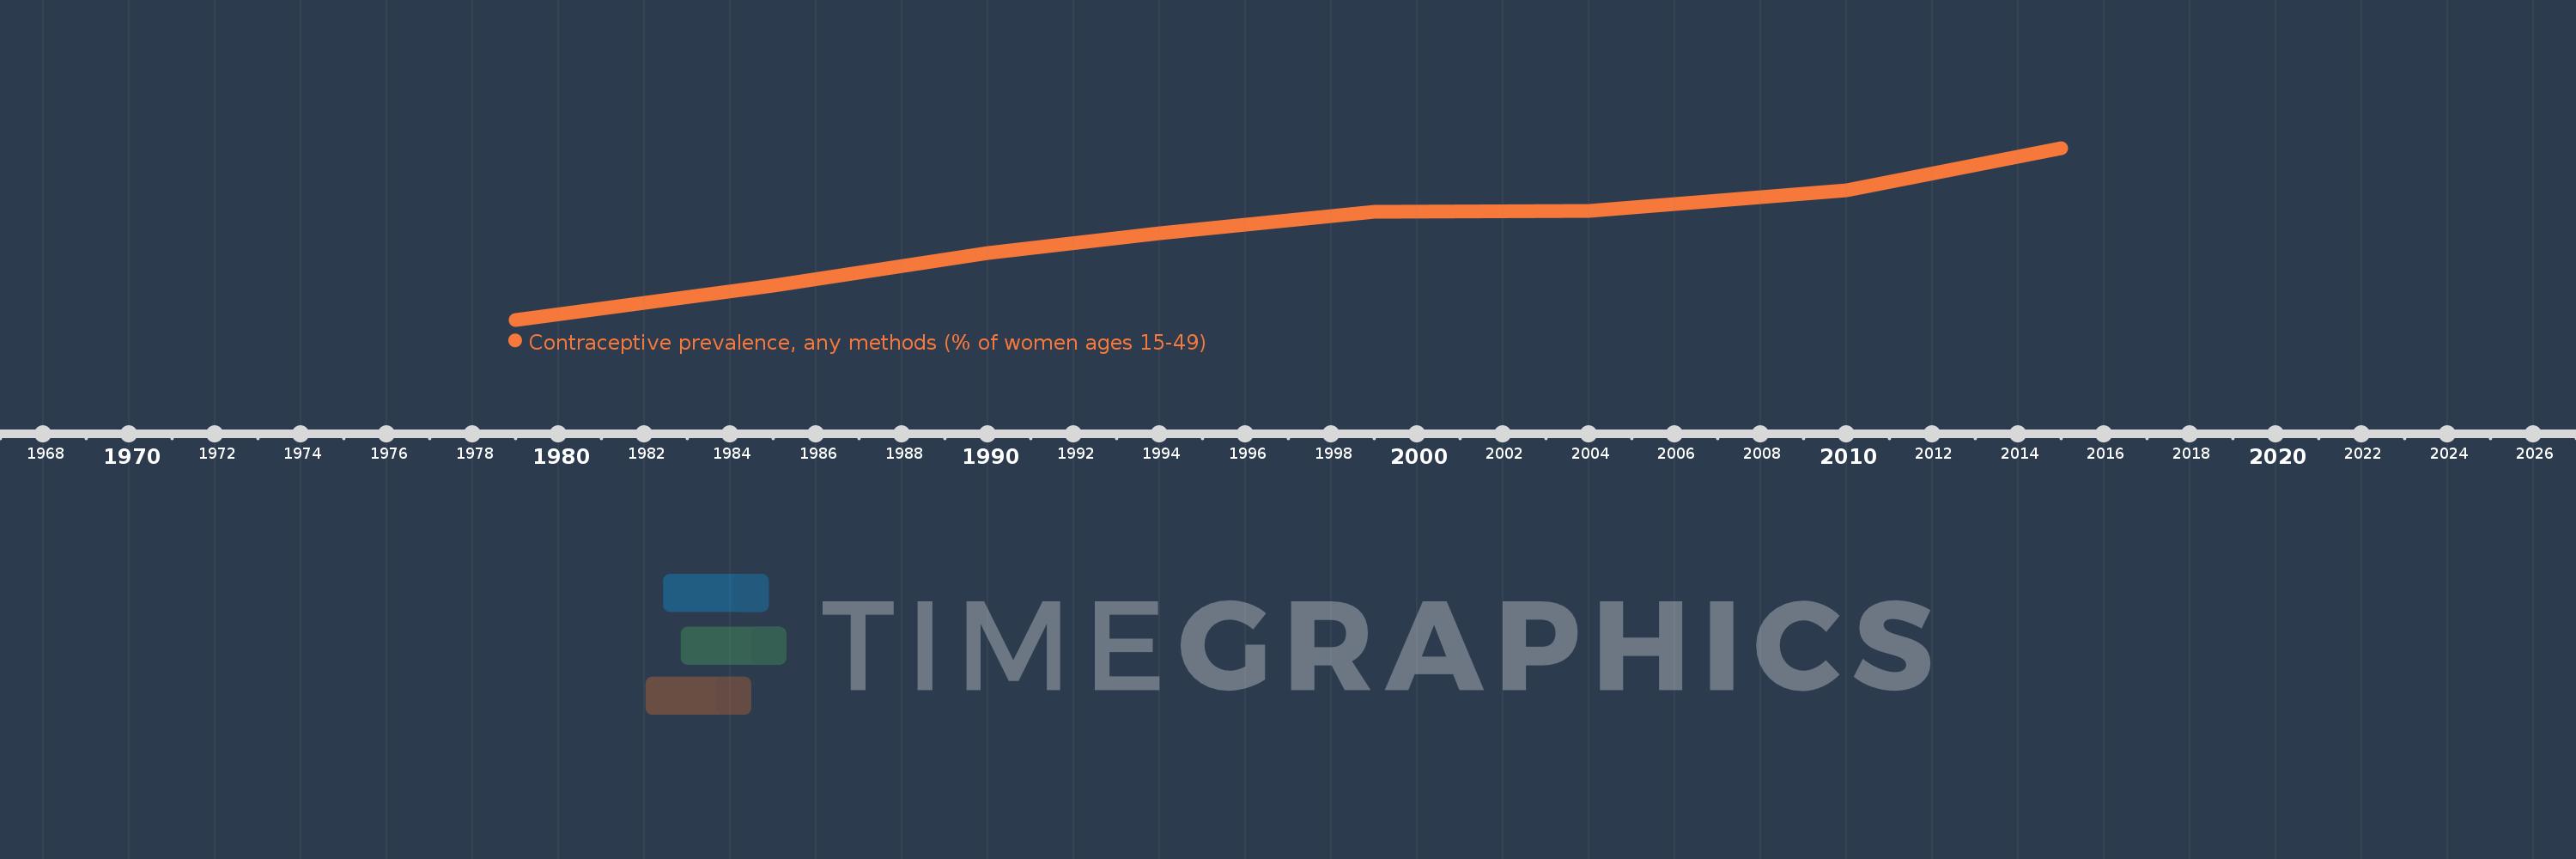
This timeline shows a graph from 1979 to 2015 of Kenya. No data until 1978. Number of actual observations by date: 8.
Source name:
World Development Indicators
Source organization:
UNICEF's State of the World's Children and Childinfo, United Nations Population Division's World Contraceptive Use, household surveys including Demographic and Health Surveys and Multiple Indicator Cluster Surveys.
Categories, topics:
Health, Gender
Last updated:
apr 23, 2017
Indicators value changes by year
Meaning:
33.175
Minimum:
7.0
jan 1, 1979
Maximum:
58.0
jan 1, 2015
At the date of observation
Value
Absolute change
Change from the previous value
jan 1, 1979
7.0
+7.0
0.0%
jan 1, 1985
17.0
+10.0
142.86%
jan 1, 1990
26.9
+9.9
58.24%
jan 1, 1994
32.7
+5.8
21.56%
jan 1, 1999
39.0
+6.3
19.27%
jan 1, 2004
39.3
+0.3
0.77%
jan 1, 2010
45.5
+6.2
15.78%
jan 1, 2015
58.0
+12.5
27.47%
Ranking of countries by current statistics by years