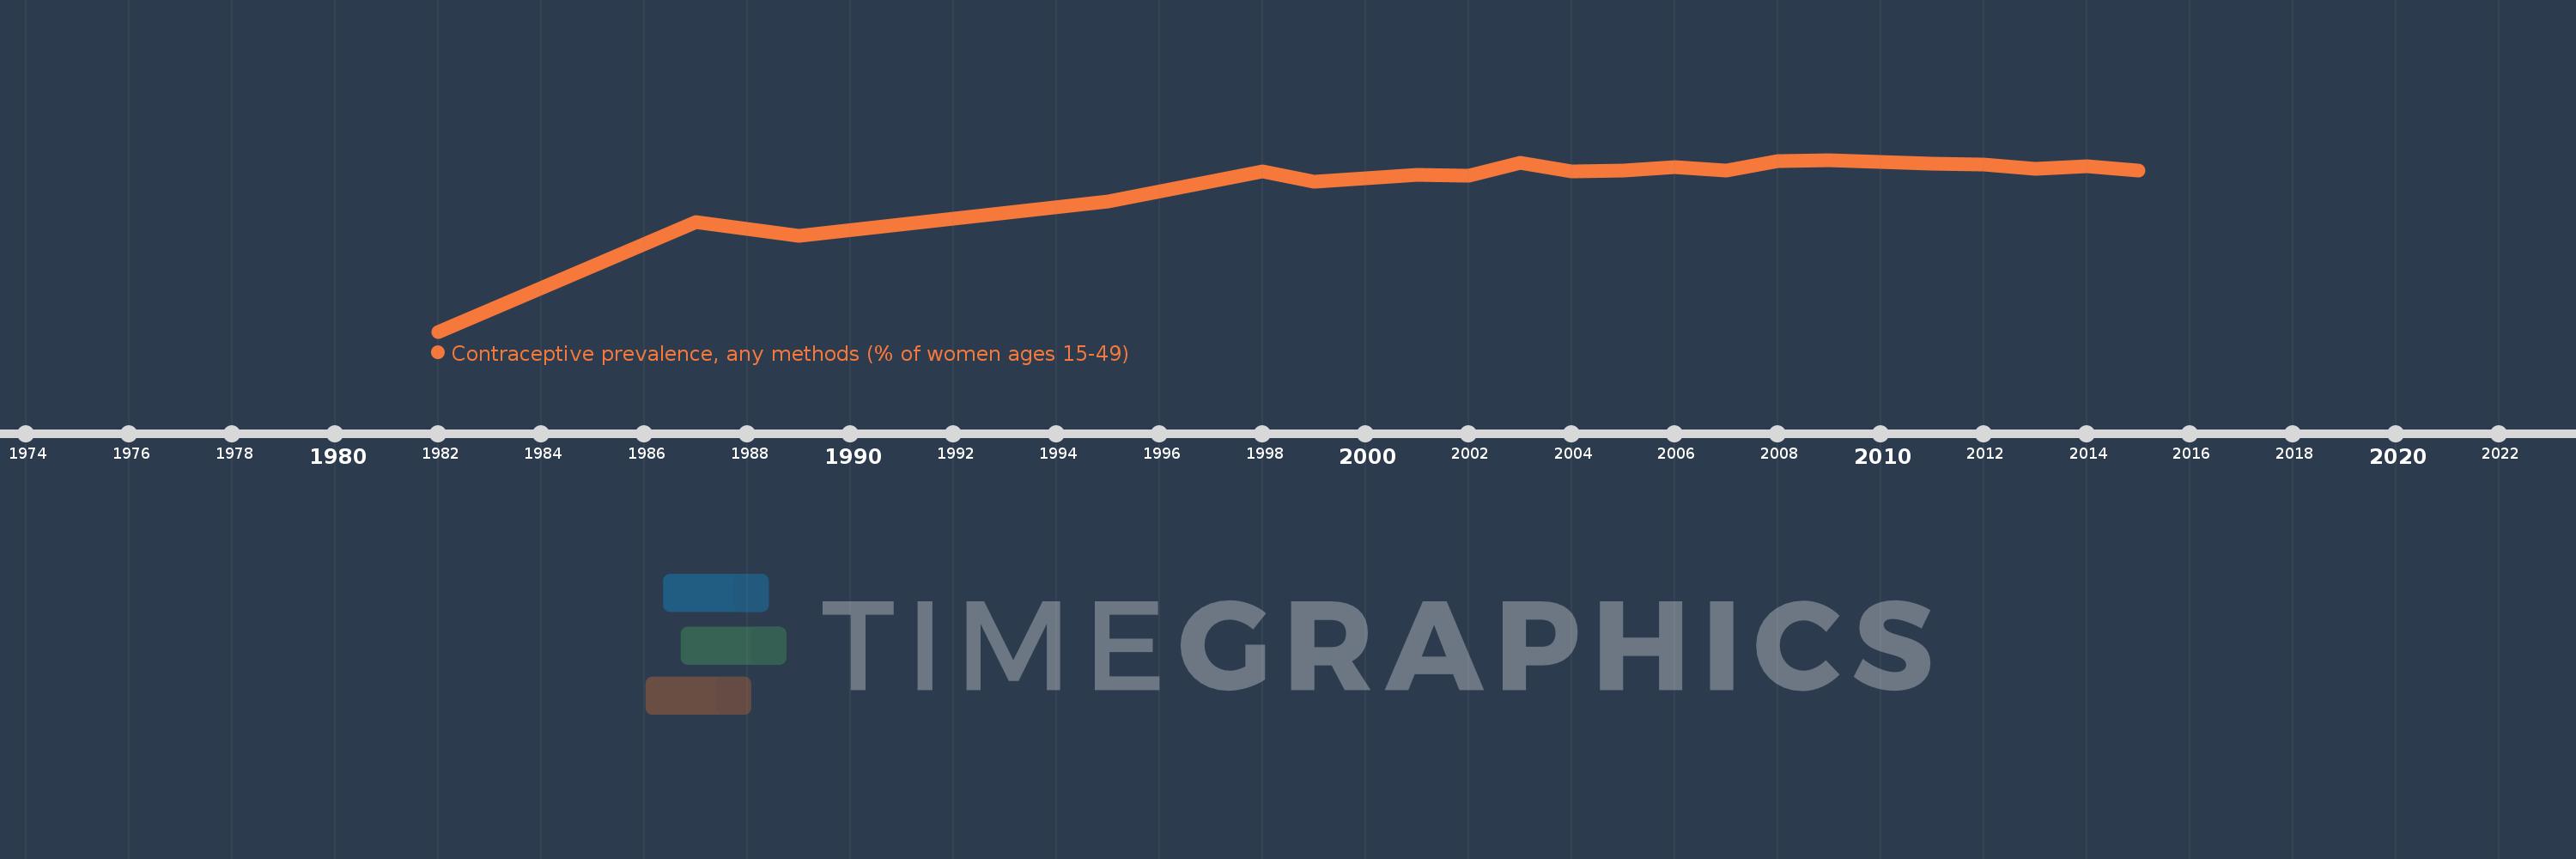
This timeline shows a graph from 1982 to 2015 of Vietnam. No data until 1981. Number of actual observations by date: 20.
Source name:
World Development Indicators
Source organization:
UNICEF's State of the World's Children and Childinfo, United Nations Population Division's World Contraceptive Use, household surveys including Demographic and Health Surveys and Multiple Indicator Cluster Surveys.
Categories, topics:
Health, Gender
Last updated:
apr 23, 2017
Indicators value changes by year
Meaning:
70.85
Minimum:
20.0
jan 1, 1982
Maximum:
79.4
jan 1, 2009
At the date of observation
Value
Absolute change
Change from the previous value
jan 1, 1982
20.0
+20.0
0.0%
jan 1, 1987
58.0
+38.0
190.0%
jan 1, 1989
53.2
-4.8
-8.28%
jan 1, 1995
65.0
+11.8
22.18%
jan 1, 1998
75.3
+10.3
15.85%
jan 1, 1999
71.9
-3.4
-4.52%
jan 1, 2001
74.2
+2.3
3.2%
jan 1, 2002
73.9
-0.3
-0.4%
jan 1, 2003
78.5
+4.6
6.22%
jan 1, 2004
75.3
-3.2
-4.08%
jan 1, 2005
75.7
+0.4
0.53%
jan 1, 2006
76.8
+1.1
1.45%
jan 1, 2007
75.7
-1.1
-1.43%
jan 1, 2008
79.0
+3.3
4.36%
jan 1, 2009
79.4
+0.4
0.51%
jan 1, 2011
78.0
-1.4
-1.76%
jan 1, 2012
77.8
-0.2
-0.26%
jan 1, 2013
76.3
-1.5
-1.93%
jan 1, 2014
77.3
+1.0
1.31%
jan 1, 2015
75.7
-1.6
-2.07%
Ranking of countries by current statistics by years