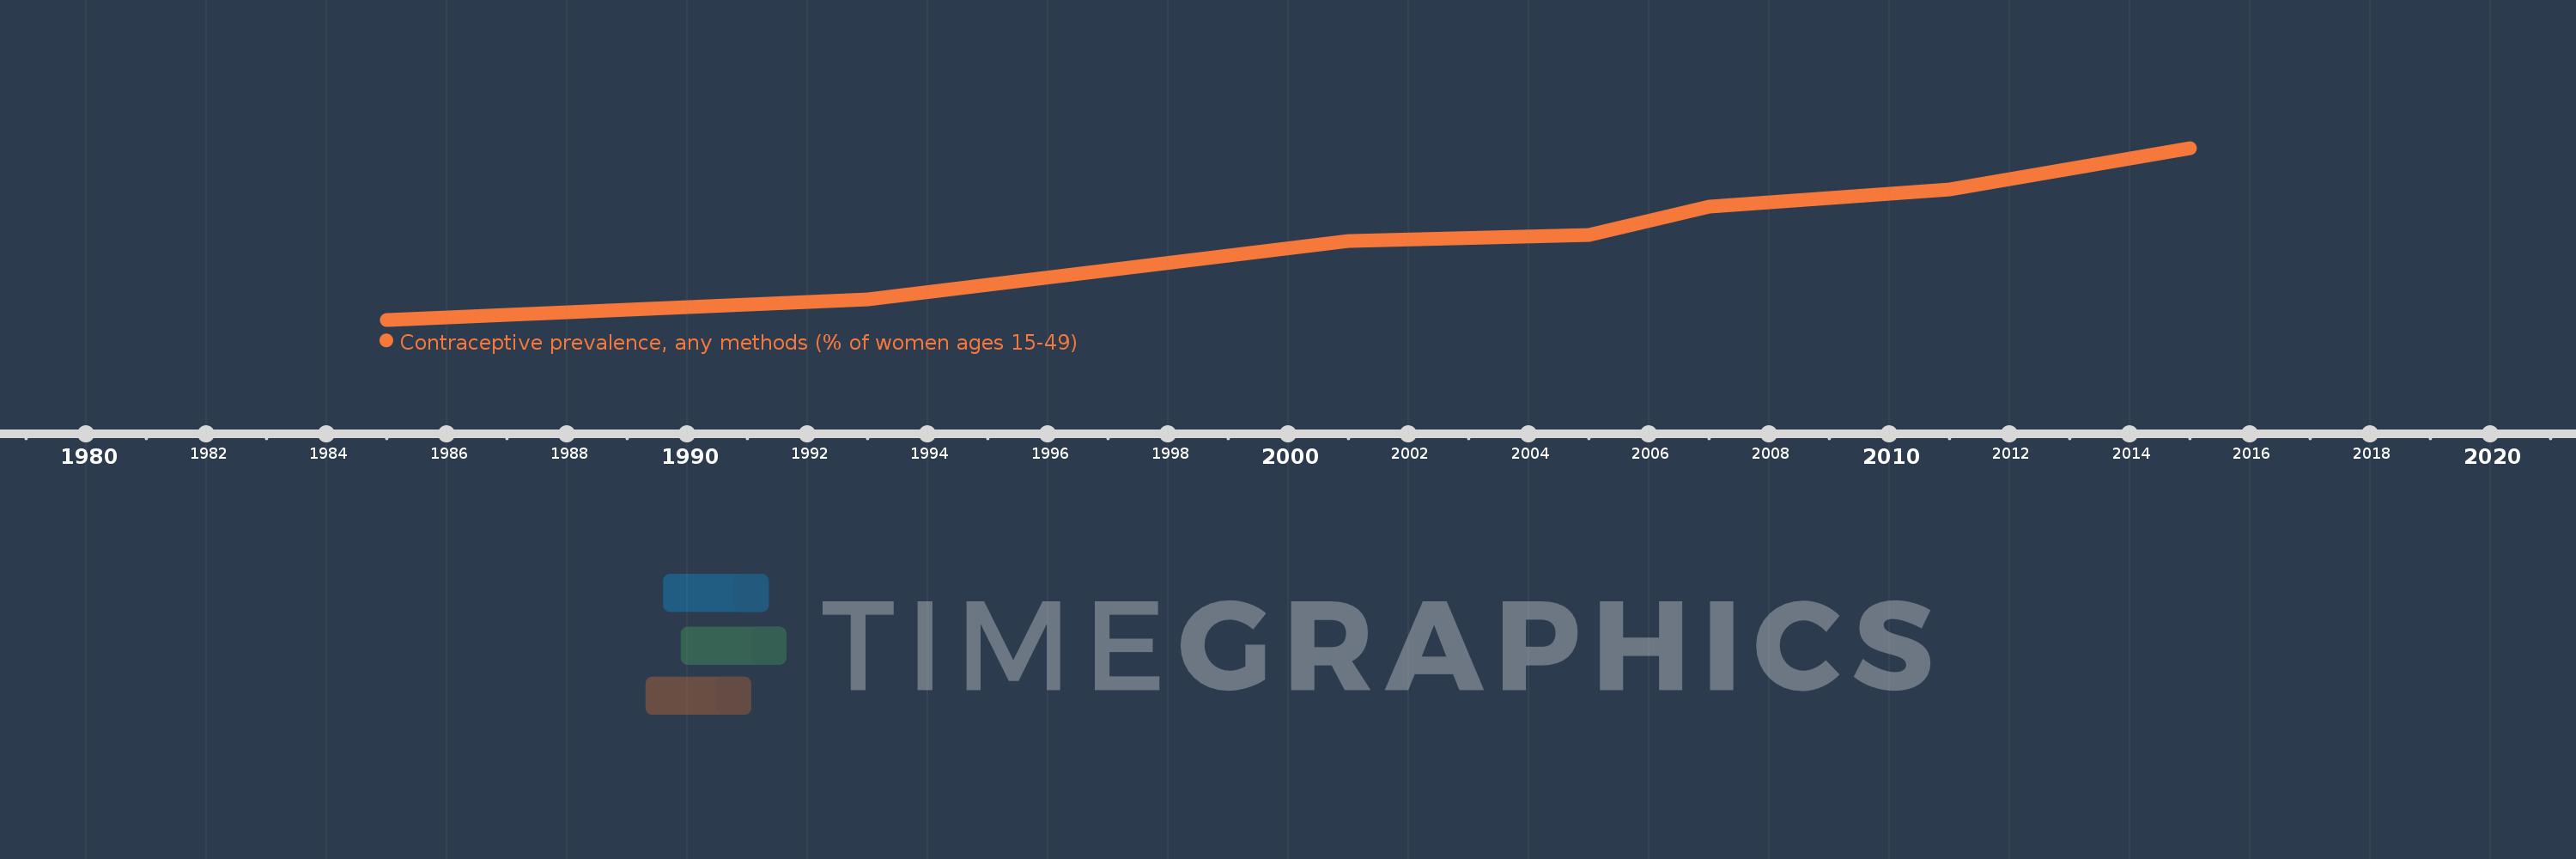
This timeline shows a graph from 1985 to 2015 of Malawi. No data until 1984. Number of actual observations by date: 8.
Source name:
World Development Indicators
Source organization:
UNICEF's State of the World's Children and Childinfo, United Nations Population Division's World Contraceptive Use, household surveys including Demographic and Health Surveys and Multiple Indicator Cluster Surveys.
Categories, topics:
Health, Gender
Last updated:
apr 23, 2017
Indicators value changes by year
Meaning:
31.325
Minimum:
6.9
jan 1, 1985
Maximum:
58.6
jan 1, 2015
At the date of observation
Value
Absolute change
Change from the previous value
jan 1, 1985
6.9
+6.9
0.0%
jan 1, 1993
13.0
+6.1
88.41%
jan 1, 1997
21.9
+8.9
68.46%
jan 1, 2001
30.6
+8.7
39.73%
jan 1, 2005
32.5
+1.9
6.21%
jan 1, 2007
41.0
+8.5
26.15%
jan 1, 2011
46.1
+5.1
12.44%
jan 1, 2015
58.6
+12.5
27.11%
Ranking of countries by current statistics by years