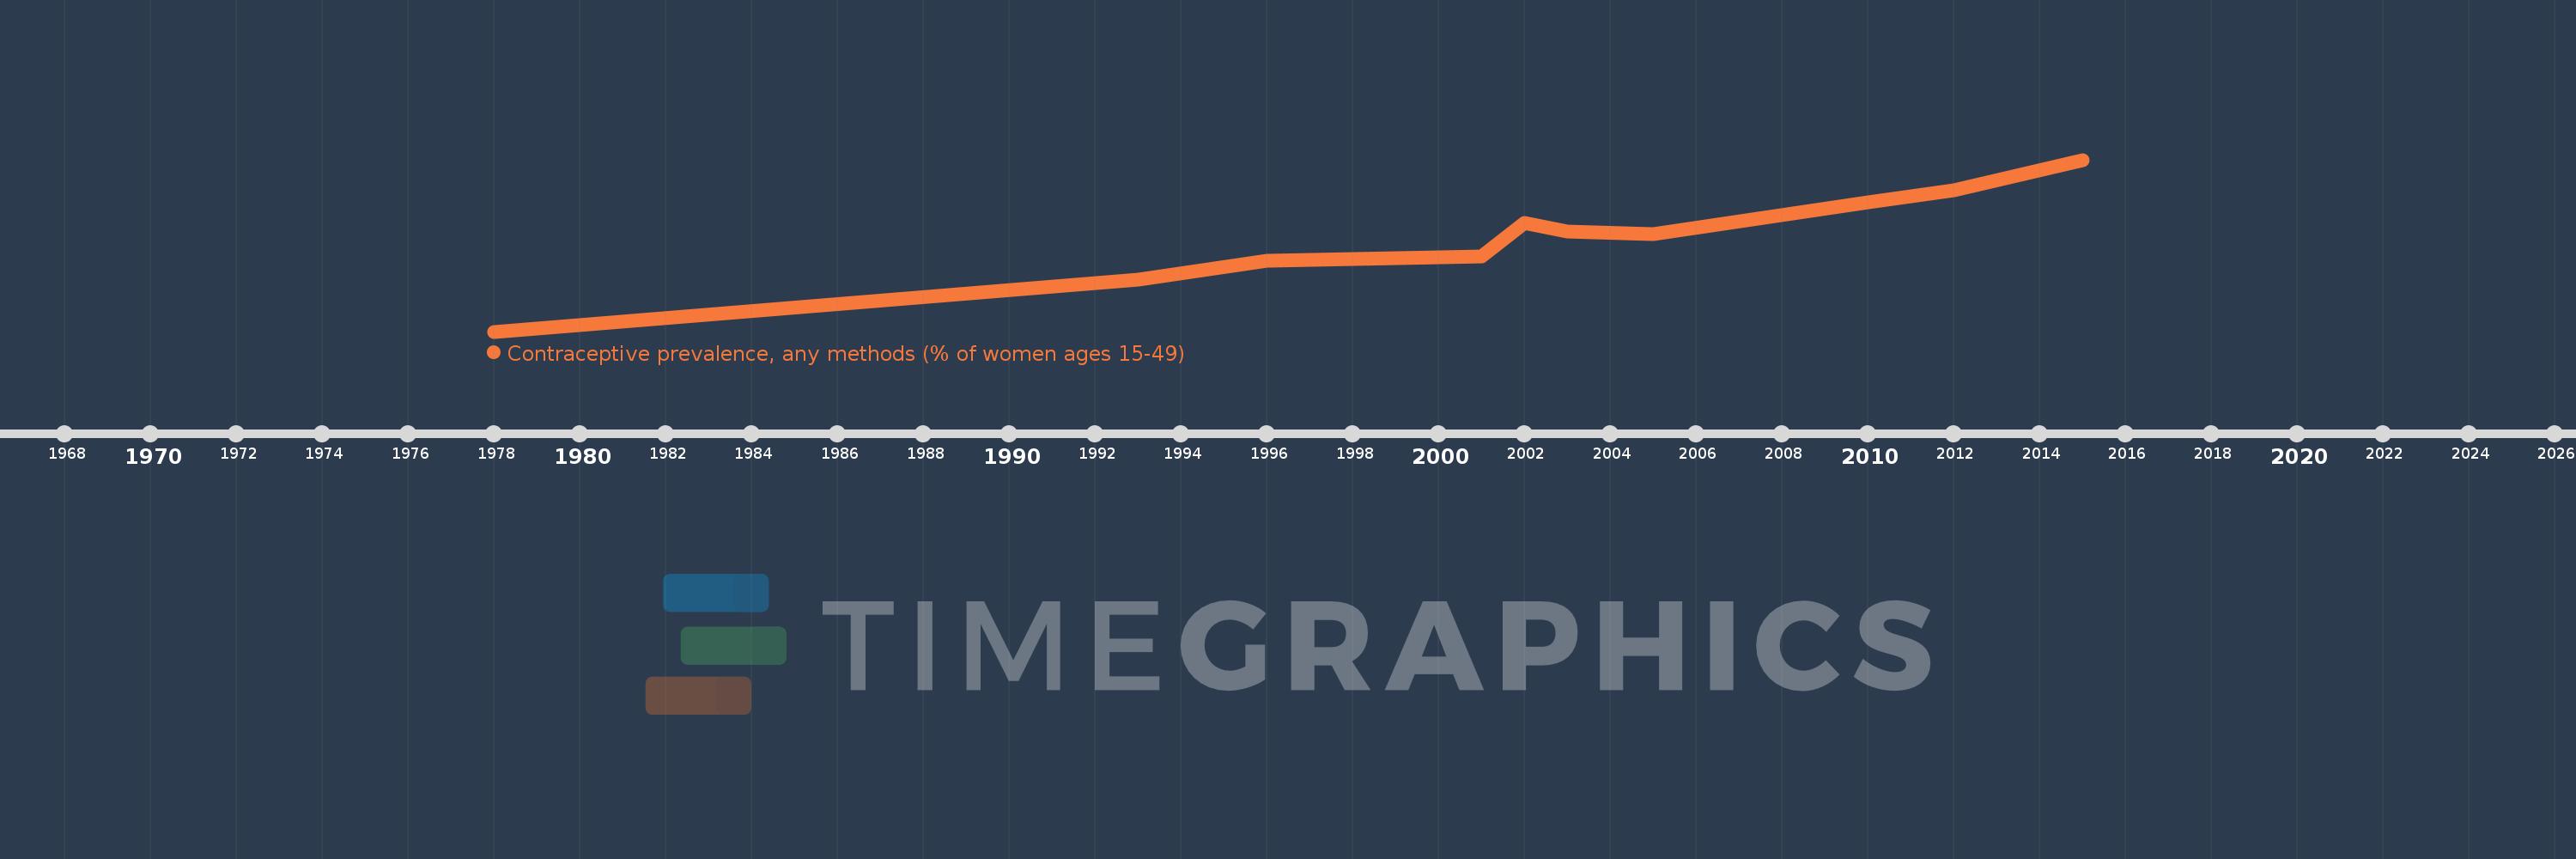
This timeline shows a graph from 1978 to 2015 of Lesotho. No data until 1977. Number of actual observations by date: 10.
Source name:
World Development Indicators
Source organization:
UNICEF's State of the World's Children and Childinfo, United Nations Population Division's World Contraceptive Use, household surveys including Demographic and Health Surveys and Multiple Indicator Cluster Surveys.
Categories, topics:
Health, Gender
Last updated:
apr 23, 2017
Indicators value changes by year
Meaning:
36.37
Minimum:
7.2
jan 1, 1978
Maximum:
60.2
jan 1, 2015
At the date of observation
Value
Absolute change
Change from the previous value
jan 1, 1978
7.2
+7.2
0.0%
jan 1, 1993
23.2
+16.0
222.22%
jan 1, 1996
29.1
+5.9
25.43%
jan 1, 2001
30.4
+1.3
4.47%
jan 1, 2002
40.6
+10.2
33.55%
jan 1, 2003
38.0
-2.6
-6.4%
jan 1, 2005
37.3
-0.7
-1.84%
jan 1, 2010
47.0
+9.7
26.01%
jan 1, 2012
50.7
+3.7
7.87%
jan 1, 2015
60.2
+9.5
18.74%
Ranking of countries by current statistics by years