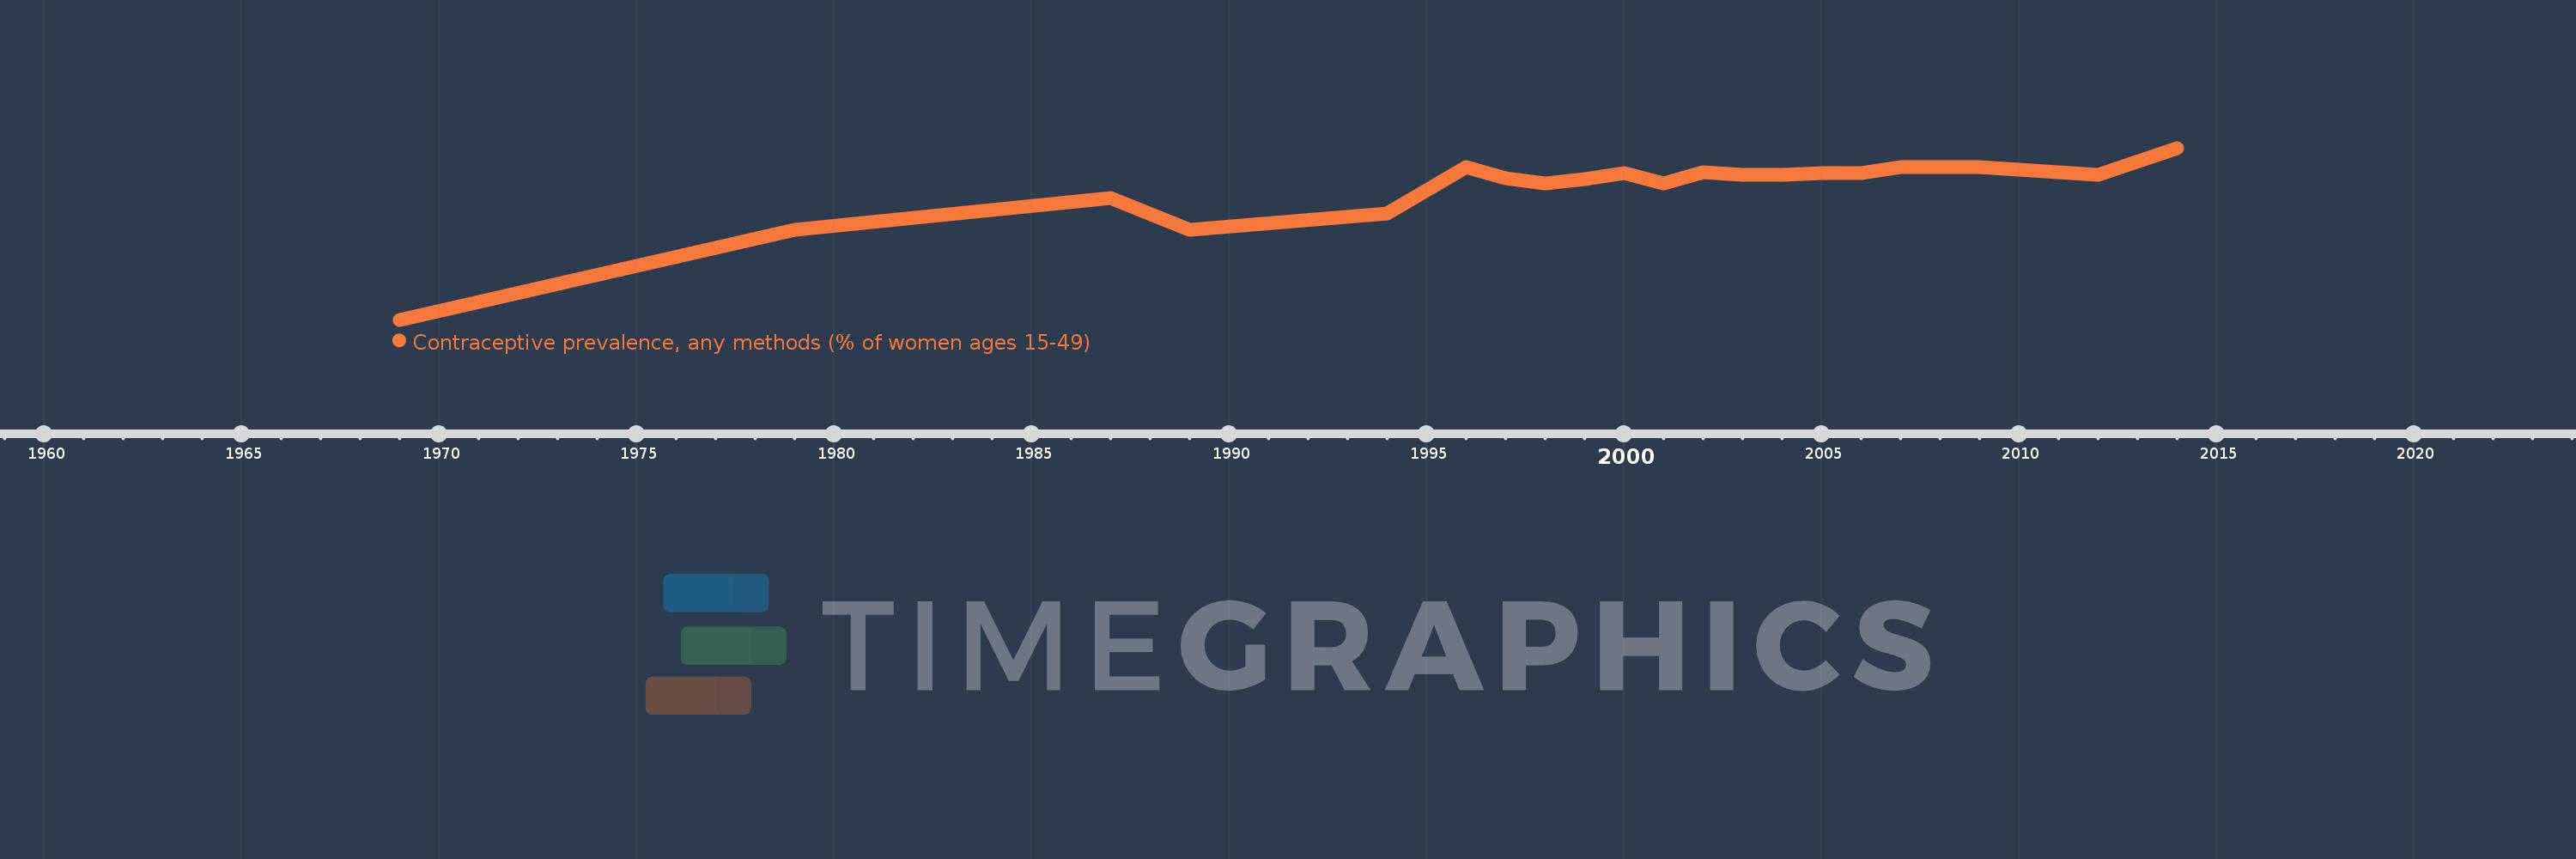
This timeline shows a graph from 1969 to 2014 of Philippines. No data until 1968. Number of actual observations by date: 20.
Source name:
World Development Indicators
Source organization:
UNICEF's State of the World's Children and Childinfo, United Nations Population Division's World Contraceptive Use, household surveys including Demographic and Health Surveys and Multiple Indicator Cluster Surveys.
Categories, topics:
Health, Gender
Last updated:
apr 23, 2017
Indicators value changes by year
Meaning:
45.62
Minimum:
15.4
jan 1, 1969
Maximum:
55.1
jan 1, 2014
At the date of observation
Value
Absolute change
Change from the previous value
jan 1, 1969
15.4
+15.4
0.0%
jan 1, 1979
36.2
+20.8
135.06%
jan 1, 1987
43.6
+7.4
20.44%
jan 1, 1989
36.2
-7.4
-16.97%
jan 1, 1994
40.0
+3.8
10.5%
jan 1, 1996
50.7
+10.7
26.75%
jan 1, 1997
48.1
-2.6
-5.13%
jan 1, 1998
47.0
-1.1
-2.29%
jan 1, 1999
47.8
+0.8
1.7%
jan 1, 2000
49.3
+1.5
3.14%
jan 1, 2001
47.0
-2.3
-4.67%
jan 1, 2002
49.5
+2.5
5.32%
jan 1, 2003
48.8
-0.7
-1.41%
jan 1, 2004
48.9
+0.1
0.2%
jan 1, 2005
49.3
+0.4
0.82%
jan 1, 2006
49.3
0.0
0.0%
jan 1, 2007
50.6
+1.3
2.64%
jan 1, 2009
50.7
+0.1
0.2%
jan 1, 2012
48.9
-1.8
-3.55%
jan 1, 2014
55.1
+6.2
12.68%
Ranking of countries by current statistics by years