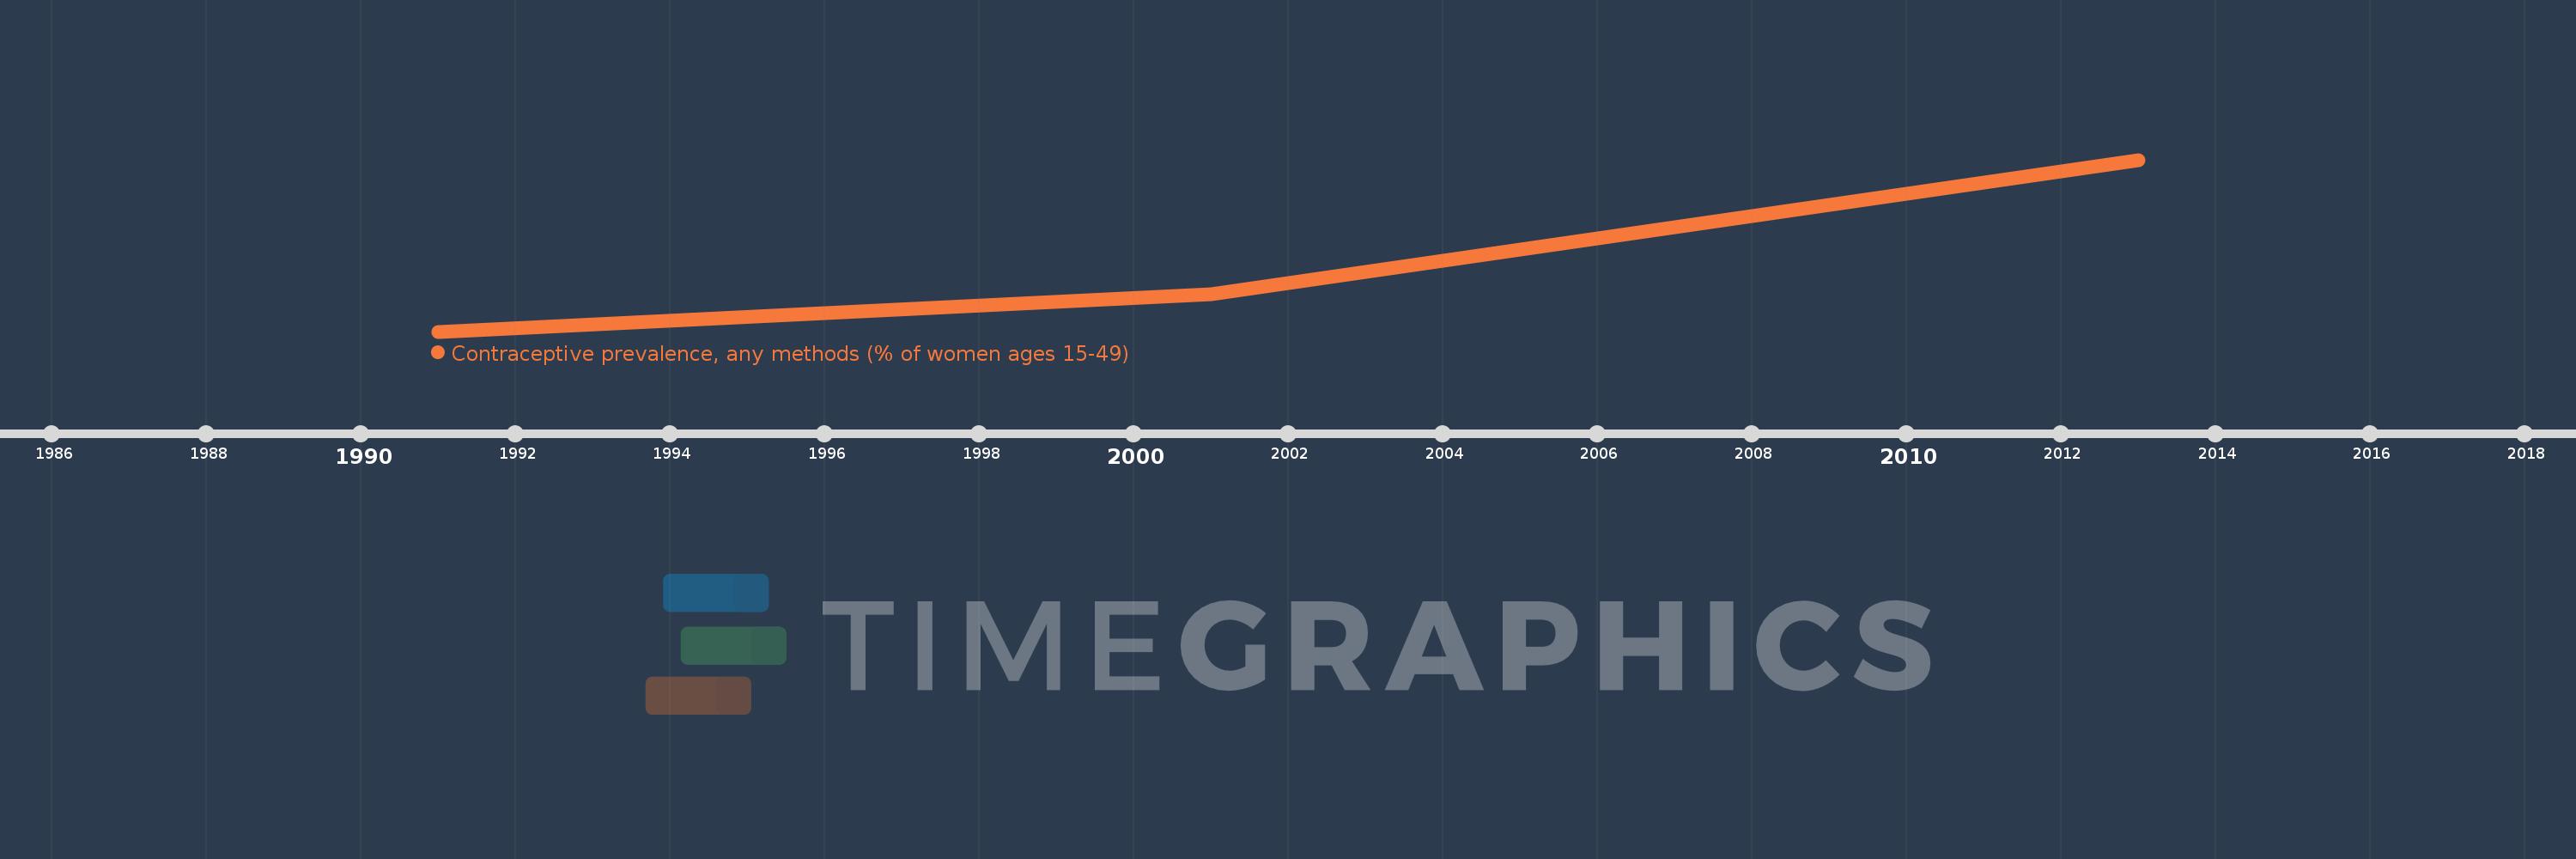
This timeline shows a graph from 1991 to 2013 of East Asia & Pacific. No data until 1990. Number of actual observations by date: 3.
Source name:
World Development Indicators
Source organization:
UNICEF's State of the World's Children and Childinfo, United Nations Population Division's World Contraceptive Use, household surveys including Demographic and Health Surveys and Multiple Indicator Cluster Surveys.
Categories, topics:
Health, Gender
Last updated:
apr 23, 2017
Indicators value changes by year
Meaning:
76.48
Minimum:
73.74
jan 1, 1991
Maximum:
80.495
jan 1, 2013
At the date of observation
Value
Absolute change
Change from the previous value
jan 1, 1991
73.74
+73.74
0.0%
jan 1, 2001
75.205
+1.466
1.99%
jan 1, 2013
80.495
+5.289
7.03%
Ranking of countries by current statistics by years