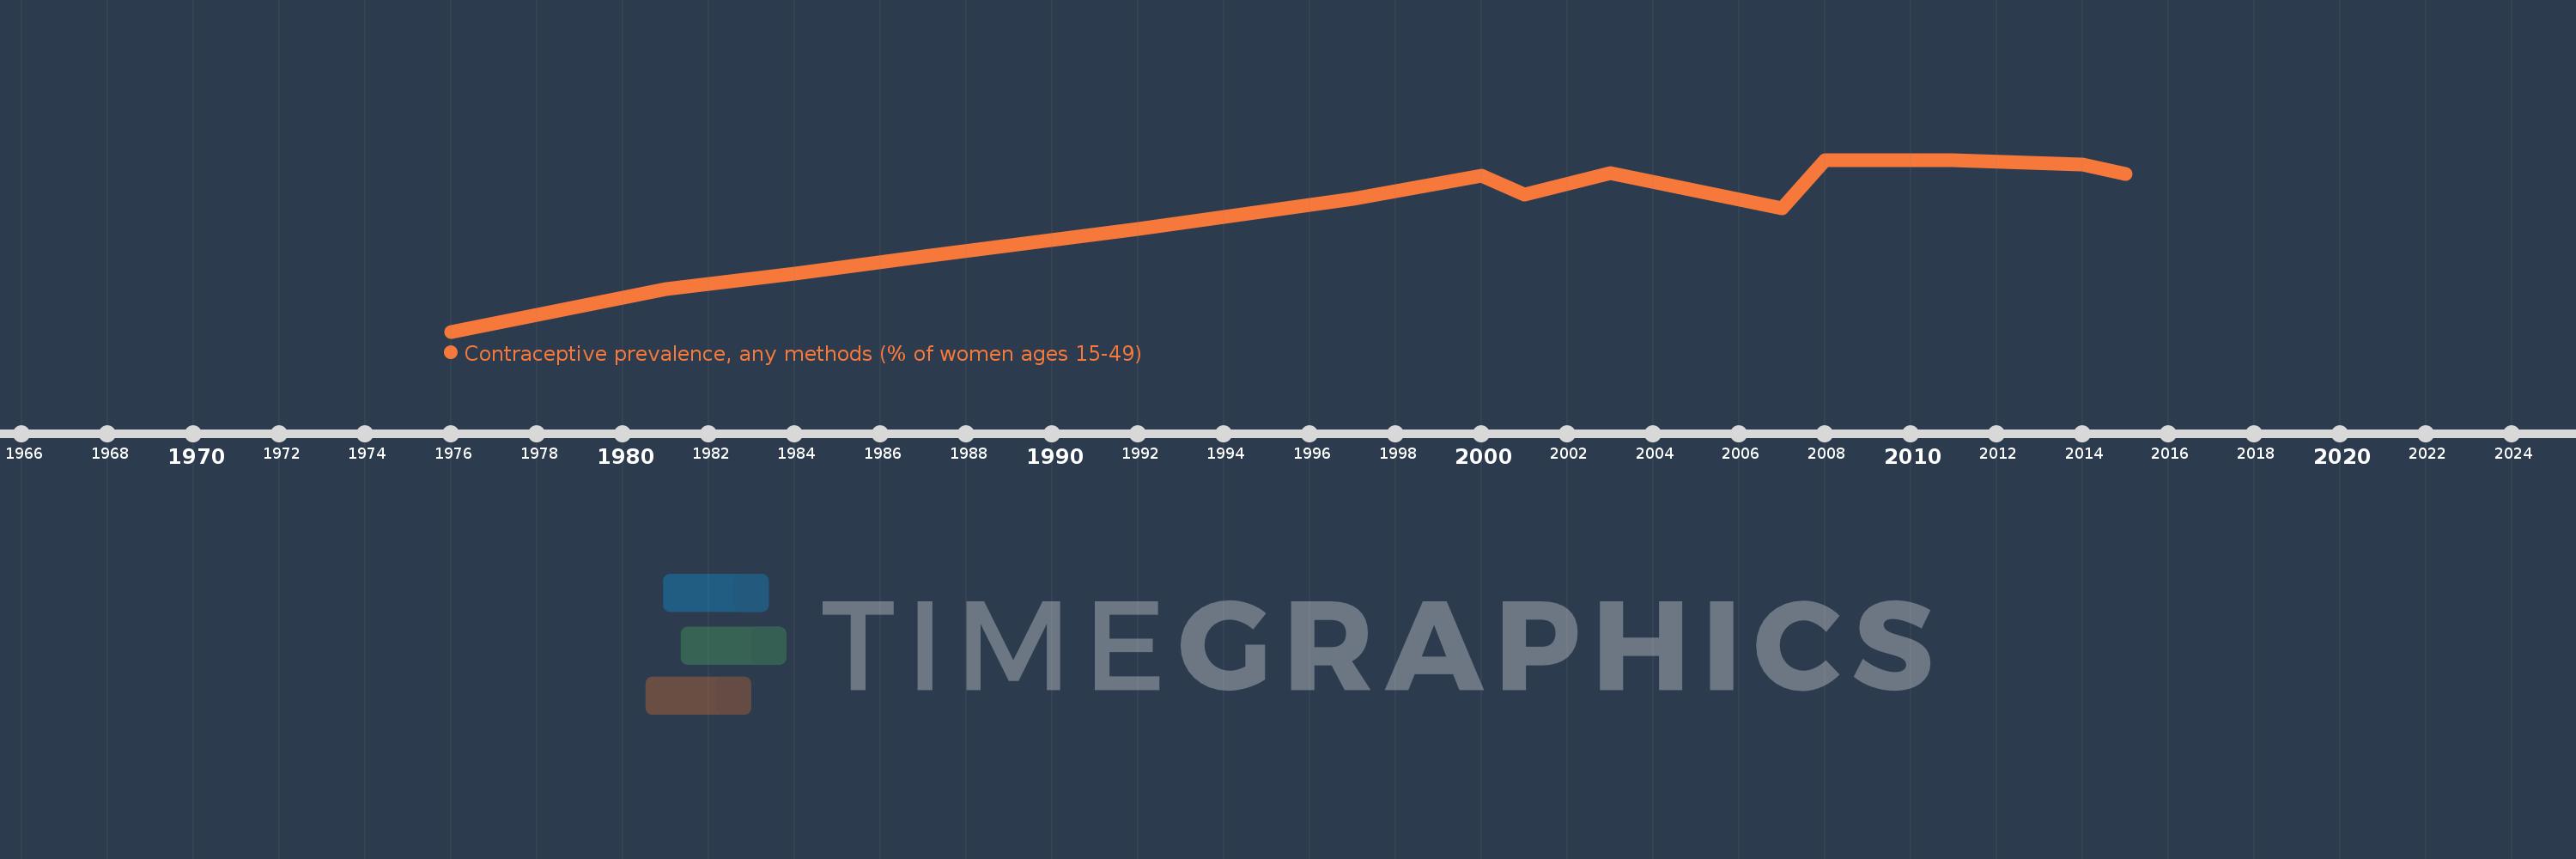
This timeline shows a graph from 1976 to 2015 of Dominican Republic. No data until 1975. Number of actual observations by date: 14.
Source name:
World Development Indicators
Source organization:
UNICEF's State of the World's Children and Childinfo, United Nations Population Division's World Contraceptive Use, household surveys including Demographic and Health Surveys and Multiple Indicator Cluster Surveys.
Categories, topics:
Health, Gender
Last updated:
apr 23, 2017
Indicators value changes by year
Meaning:
60.136
Minimum:
31.8
jan 1, 1976
Maximum:
73.0
jan 1, 2011
At the date of observation
Value
Absolute change
Change from the previous value
jan 1, 1976
31.8
+31.8
0.0%
jan 1, 1981
42.0
+10.2
32.08%
jan 1, 1984
45.8
+3.8
9.05%
jan 1, 1987
49.8
+4.0
8.73%
jan 1, 1992
56.4
+6.6
13.25%
jan 1, 1997
63.7
+7.3
12.94%
jan 1, 2000
69.2
+5.5
8.63%
jan 1, 2001
64.7
-4.5
-6.5%
jan 1, 2003
69.8
+5.1
7.88%
jan 1, 2007
61.3
-8.5
-12.18%
jan 1, 2008
72.9
+11.6
18.92%
jan 1, 2011
73.0
+0.1
0.14%
jan 1, 2014
71.9
-1.1
-1.51%
jan 1, 2015
69.6
-2.3
-3.2%
Ranking of countries by current statistics by years