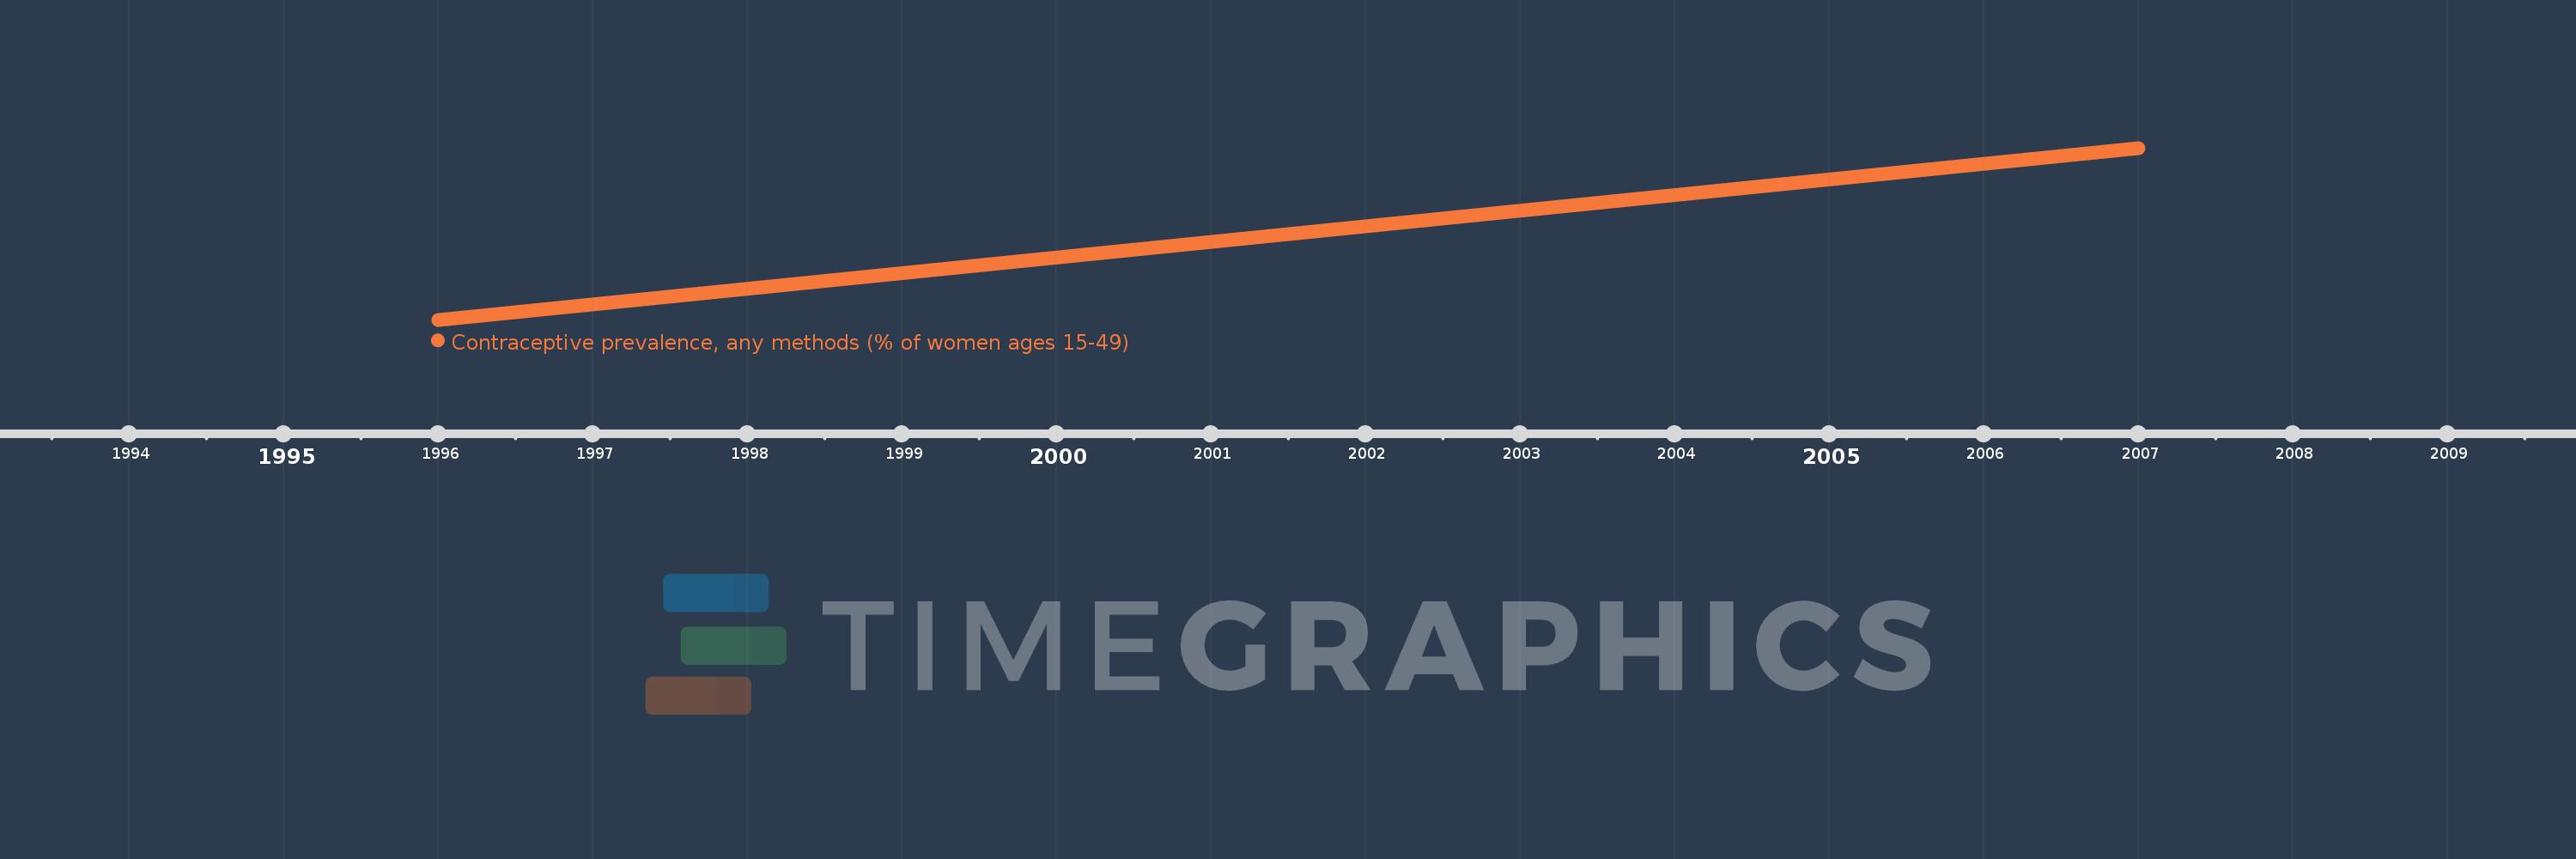
This timeline shows a graph from 1996 to 2007 of Lithuania. No data until 1995. Number of actual observations by date: 2.
Source name:
World Development Indicators
Source organization:
UNICEF's State of the World's Children and Childinfo, United Nations Population Division's World Contraceptive Use, household surveys including Demographic and Health Surveys and Multiple Indicator Cluster Surveys.
Categories, topics:
Health, Gender
Last updated:
apr 23, 2017
Indicators value changes by year
Meaning:
56.8
Minimum:
50.7
jan 1, 1996
Maximum:
62.9
jan 1, 2007
At the date of observation
Value
Absolute change
Change from the previous value
jan 1, 1996
50.7
+50.7
0.0%
jan 1, 2007
62.9
+12.2
24.06%
Ranking of countries by current statistics by years