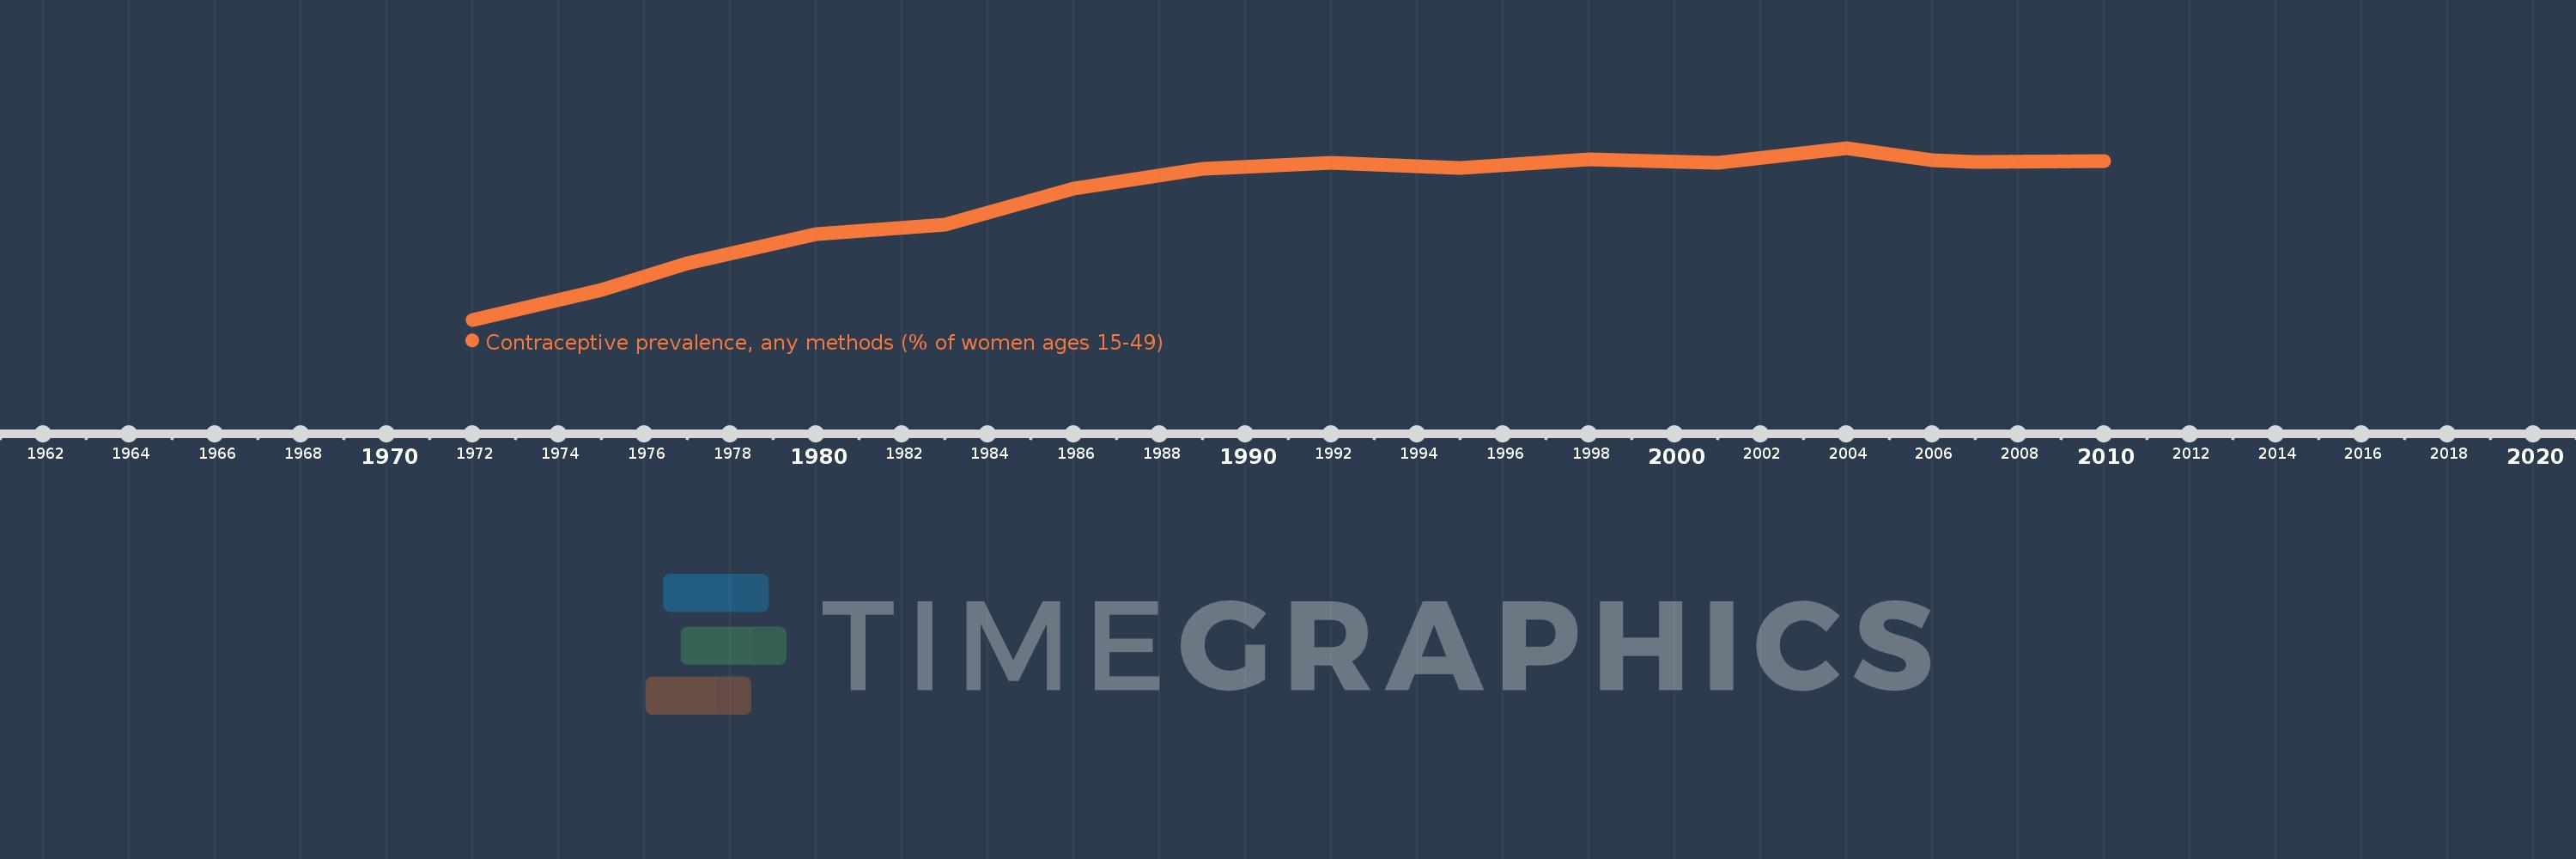
This timeline shows a graph from 1972 to 2010 of Korea, Rep.. No data until 1971. Number of actual observations by date: 15.
Source name:
World Development Indicators
Source organization:
UNICEF's State of the World's Children and Childinfo, United Nations Population Division's World Contraceptive Use, household surveys including Demographic and Health Surveys and Multiple Indicator Cluster Surveys.
Categories, topics:
Health, Gender
Last updated:
apr 23, 2017
Indicators value changes by year
Meaning:
66.947
Minimum:
24.5
jan 1, 1972
Maximum:
84.5
jan 1, 2004
At the date of observation
Value
Absolute change
Change from the previous value
jan 1, 1972
24.5
+24.5
0.0%
jan 1, 1975
34.9
+10.4
42.45%
jan 1, 1977
44.2
+9.3
26.65%
jan 1, 1980
54.5
+10.3
23.3%
jan 1, 1983
57.7
+3.2
5.87%
jan 1, 1986
70.4
+12.7
22.01%
jan 1, 1989
77.1
+6.7
9.52%
jan 1, 1992
79.4
+2.3
2.98%
jan 1, 1995
77.4
-2.0
-2.52%
jan 1, 1998
80.5
+3.1
4.01%
jan 1, 2001
79.3
-1.2
-1.49%
jan 1, 2004
84.5
+5.2
6.56%
jan 1, 2006
80.2
-4.3
-5.09%
jan 1, 2007
79.6
-0.6
-0.75%
jan 1, 2010
80.0
+0.4
0.5%
Ranking of countries by current statistics by years