Download This statistics in other country:
Timeline:
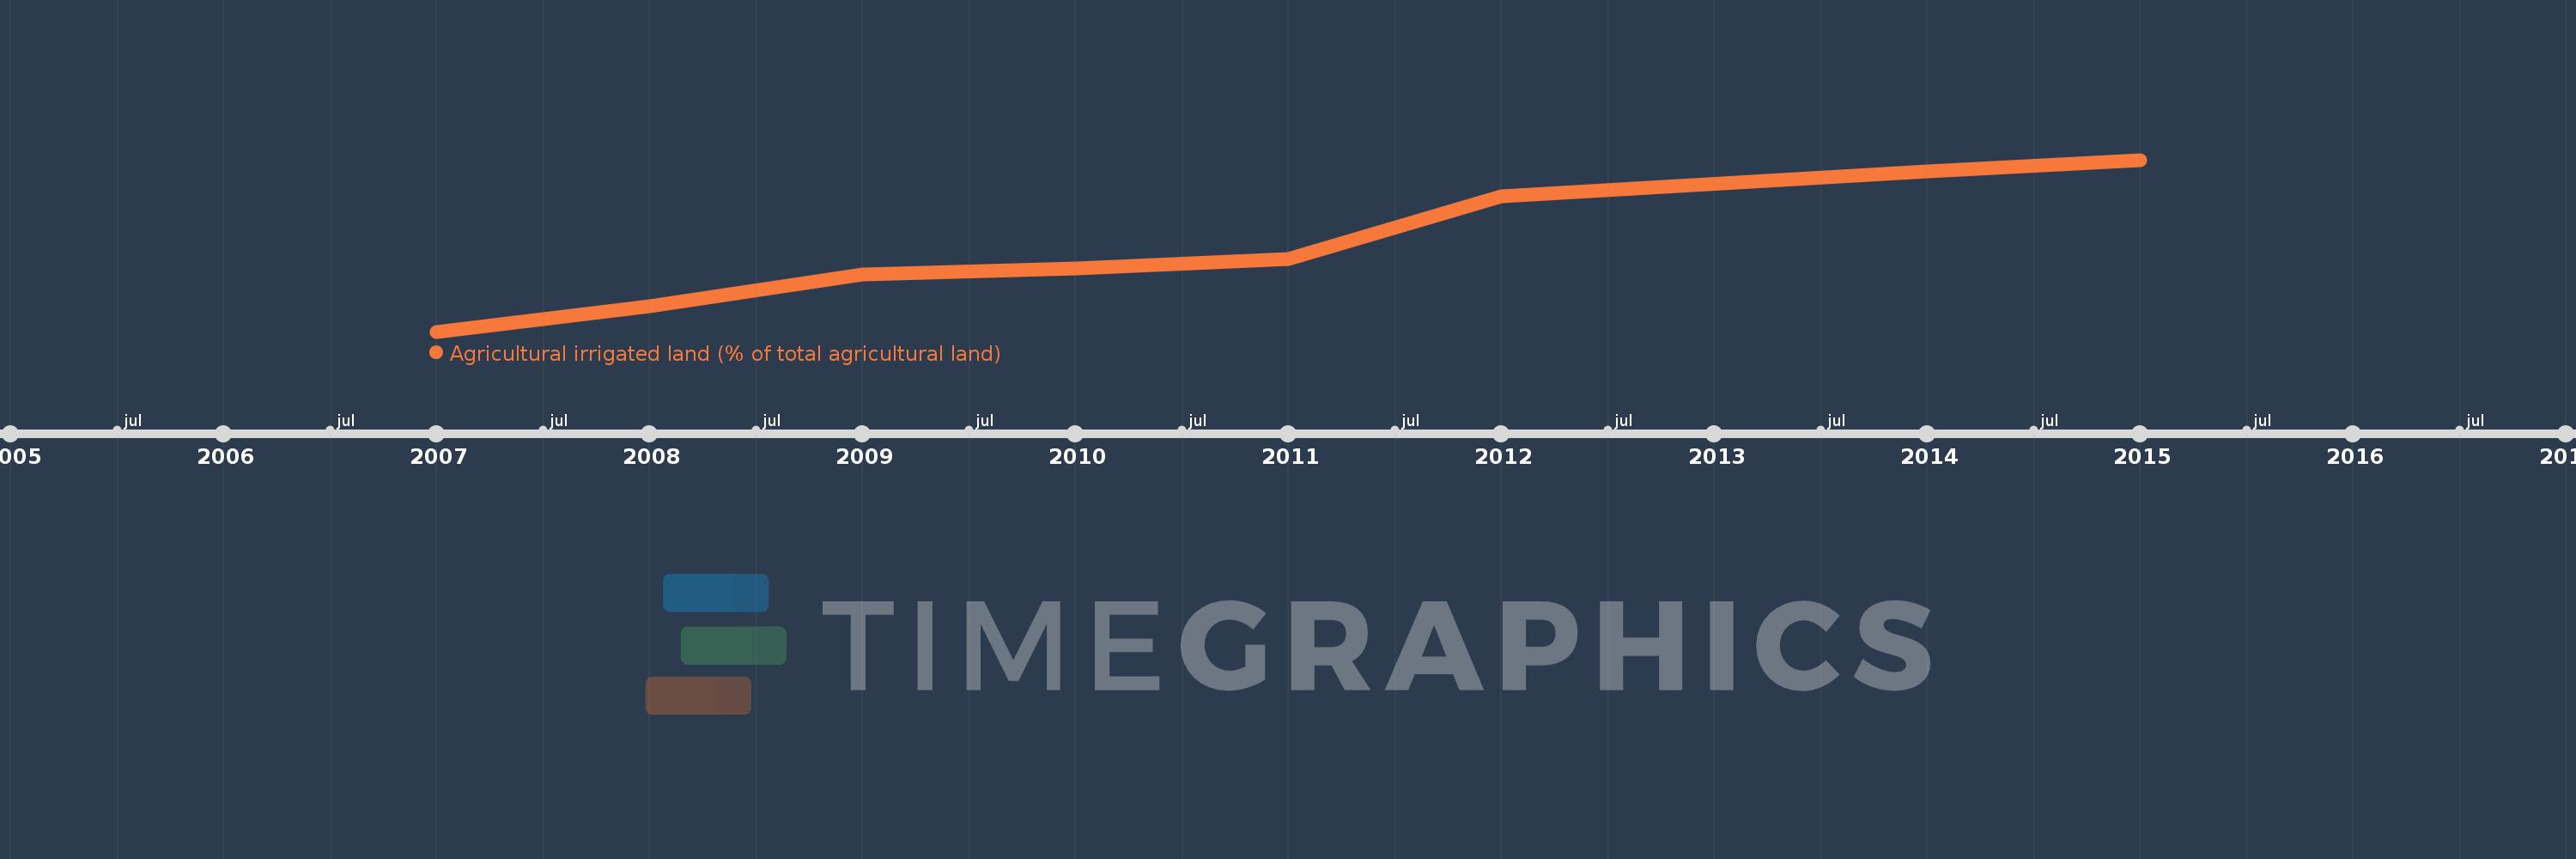
This timeline shows a graph from 2007 to 2015 of Armenia. No data until 2006. Number of actual observations by date: 8.
Source name:
World Development Indicators
Source organization:
Food and Agriculture Organization, electronic files and web site.
Categories, topics:
Agriculture & Rural Development, Climate Change
Last updated:
apr 23, 2017
Indicators value changes by year
At the date of observation
Value
Absolute change
Change from the previous value
jan 1, 2007
8.762
+8.762
0.0%
jan 1, 2008
8.825
+0.062
0.71%
jan 1, 2009
8.907
+0.082
0.93%
jan 1, 2010
8.922
+0.015
0.17%
jan 1, 2011
8.945
+0.024
0.26%
jan 1, 2012
9.104
+0.159
1.78%
jan 1, 2014
9.167
+0.063
0.69%
jan 1, 2015
9.196
+0.029
0.32%
Ranking of countries by current statistics by years